
W Chart Pattern: Trader-Tested Strategy Using the Double Bottom Pattern
Markets rarely reverse in a straight line. Before a downtrend turns into an uptrend, price usually pauses, retests key levels, and forces both buyers and sellers to reveal their hand. The w chart pattern captures this exact moment of transition. It is one of the most reliable reversal structures in technical analysis because it is built on confirmation, not prediction.
Often referred to as the double bottom pattern, the w chart pattern has been used by traders for decades across forex, stocks, indices, and crypto. It works because it reflects real order flow: sellers attempt to push price lower twice and fail. When resistance finally breaks, the market sends a clear signal that control is shifting.
This guide explains the w chart pattern in depth - how it forms, why it works, how traders apply it in real conditions, and how to avoid the most common mistakes. Everything is explained in plain language, with a focus on execution rather than theory. For traders who apply patterns like the w chart pattern in live markets, execution matters. Platforms such as Dominion Options are often used because of low spreads, fast order execution, and access to MT5, which support precise chart analysis and risk control.
What Is the W Chart Pattern?
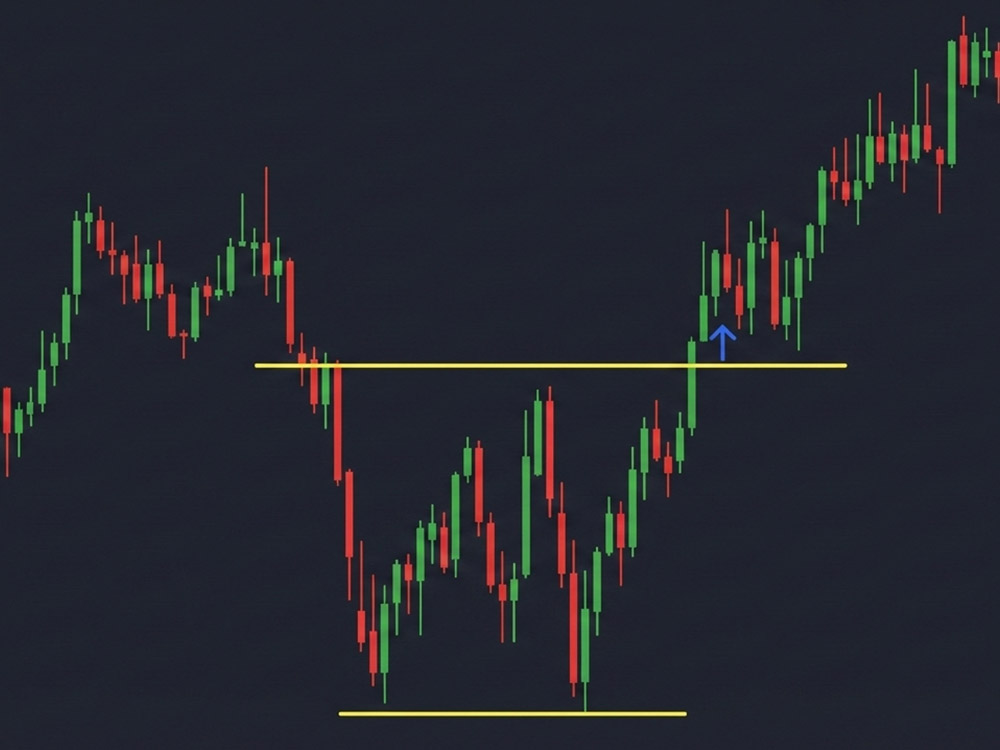
The w chart pattern is a bullish reversal pattern that forms after a sustained downtrend. Visually, price creates two major swing lows at approximately the same level, with a temporary bounce between them. When plotted on a chart, this structure resembles the letter “W.”
This pattern is also known as the double bottom pattern, and both terms are commonly used in w pattern trading.
Traders who want broader context can compare it with other classic setups covered in the guide to different forex chart patterns.
Regardless of the name, the meaning stays the same: downside momentum is weakening, buyers are stepping in, and the probability of a bullish reversal increases once confirmation occurs.
At its core, the w chart pattern consists of:
- A prior downtrend
- A first bottom where price finds support
- A pullback that forms resistance (the neckline)
- A second bottom that fails to break lower
- A breakout above resistance, known as the w pattern breakout
Until that breakout happens, the pattern is incomplete.
What Is the W Chart Pattern?
Why the W Chart Pattern Works So Well
The effectiveness of the w chart pattern comes from market psychology. Every leg of the pattern represents a shift in behavior between buyers and sellers. These concepts are explored in more detail in technical analysis for forex trading, where traders learn how patterns like the w chart pattern fit into a broader analytical framework.
Every leg of the pattern represents a shift in behavior between buyers and sellers.
- The first drop reflects strong selling pressure
- The bounce shows early buying interest
- The second drop tests whether sellers are still in control
- The failure to break lower exposes seller exhaustion
- The breakout confirms buyer dominance
This is why traders trust the double bottom candlestick pattern more than single-bottom reversals. It forces the market to test support twice and prove that demand exists before any trade is taken.
Unlike aggressive reversal strategies, w pattern trading waits for evidence. That patience is what makes it trader-tested.
What Does a Double Bottom Look Like
What Does a Double Bottom Look Like
Not every “W-shaped” move qualifies as a tradable setup. A high-quality w chart pattern has clear structural rules.
1. A Clear Downtrend
The pattern must appear after a bearish move. Without a downtrend, the double bottom pattern loses its reversal significance. Sideways markets produce unreliable signals.
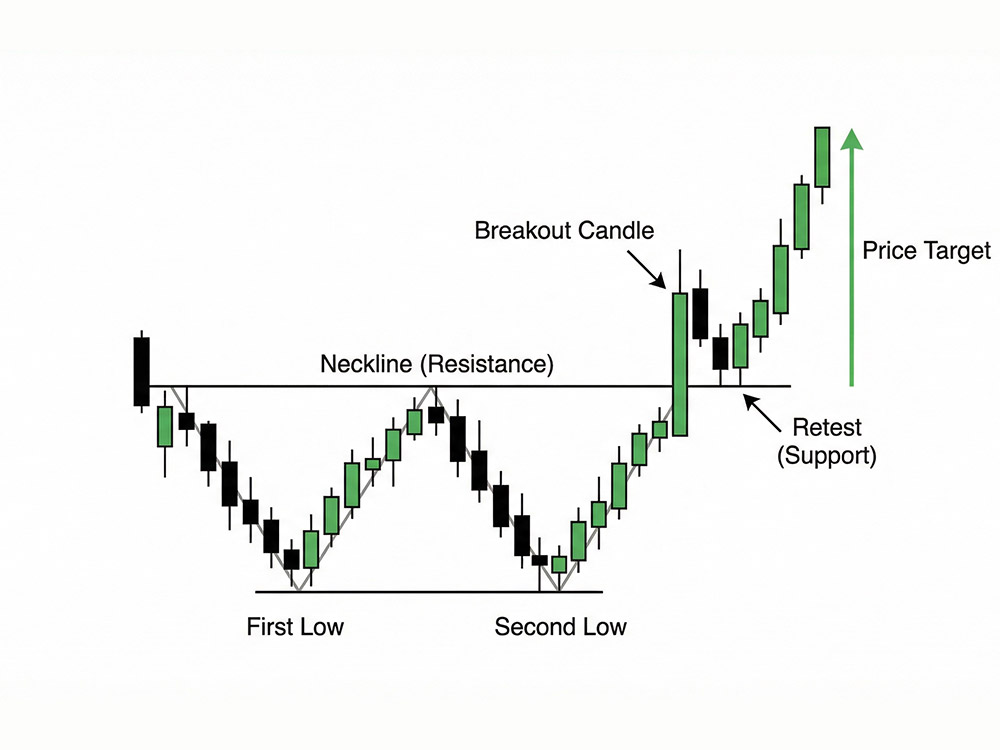
2. First Bottom: Initial Support
Price falls and finds an area where buying pressure slows the decline. This first bottom establishes a support zone, not an exact price level.
3. Neckline Resistance
After the bounce, price stalls and pulls back. The high of this move forms the neckline. This level is critical because a w pattern breakout above it confirms the reversal.
4. Second Bottom: Failed Breakdown
Price returns to the support zone. The second bottom can be:
- Equal to the first bottom
- Slightly higher (often bullish)
- Slightly lower but quickly reclaimed
What matters is rejection, not symmetry.
5. Breakout Confirmation
The w chart pattern is confirmed only when price closes above the neckline. Entering before this step is speculation, not strategy.
The Psychology Behind the Double Bottom Pattern
Understanding the psychology behind the double bottom pattern helps traders stay patient and disciplined.
At the first bottom, fear dominates. Sellers are aggressive, and buyers are cautious. The bounce that follows is often dismissed as a temporary pullback.
At the second bottom, sellers expect a breakdown. Stop-loss orders sit below support. When price fails to collapse, sellers begin to exit, and buyers gain confidence.
The w pattern breakout triggers short covering and fresh buying interest, creating momentum in the new direction.
This psychological shift is why the w chart pattern often leads to sustained moves rather than brief bounces.
How Traders Use the W Chart Pattern in Real Trading
There are multiple ways to trade the w chart pattern, but all professional approaches share one rule: confirmation comes first.
Entry Methods
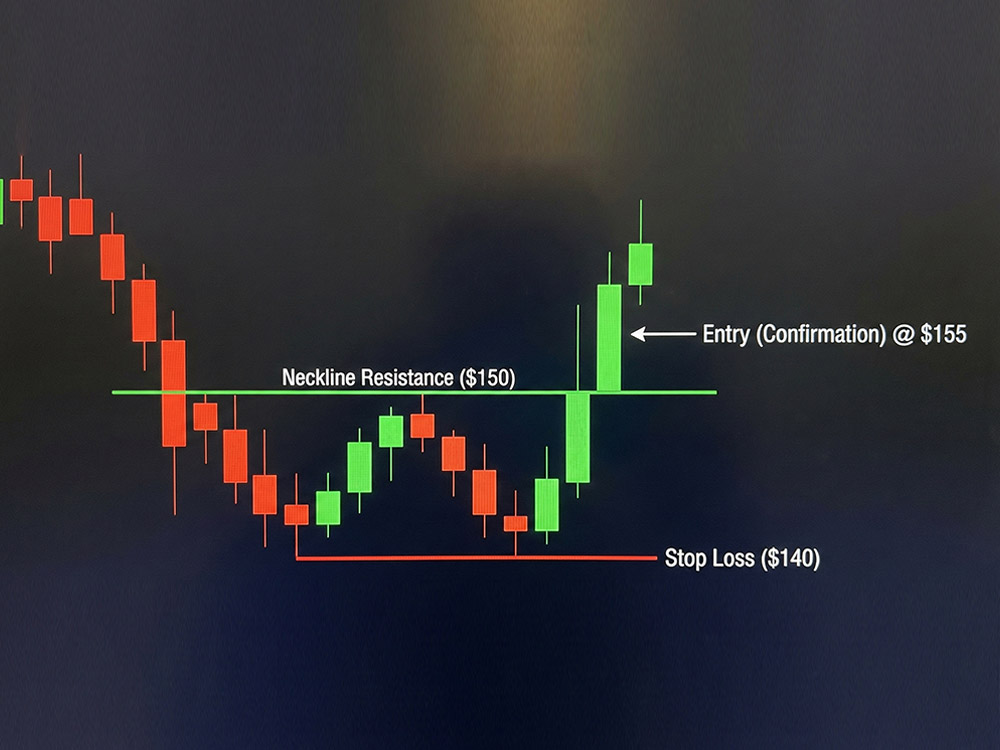
Conservative Entry (Most Common)
Traders enter after a confirmed close above the neckline. This aligns the trade with momentum and reduces false signals.
Conservative Entry (Most Common)
Aggressive Entry (Advanced Traders)
Some traders enter near the second bottom after strong rejection candles. This offers better risk-to-reward but increases failure risk.
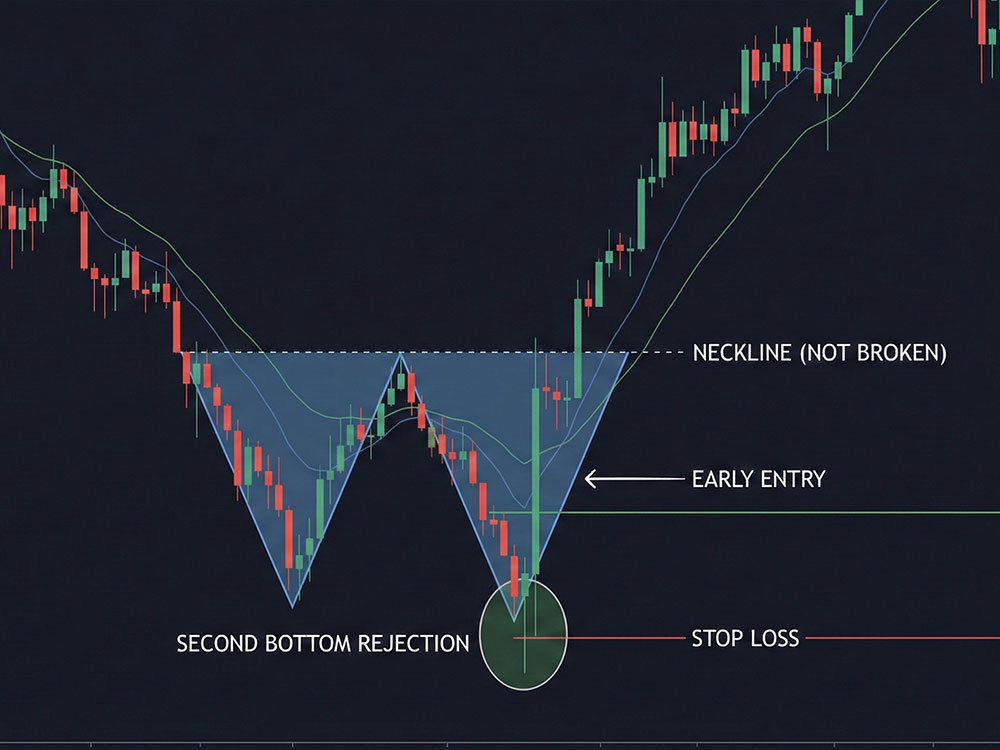
Aggressive Entry (Advanced Traders)
For most traders, conservative w pattern trading produces more consistent results. This approach fits well alongside other structured methods outlined in proven forex trading strategies used by experienced traders.
Stop-Loss Placement for the W Chart Pattern
Stops should be placed where the idea is clearly invalidated.
Common stop locations include:
- Below the second bottom swing low
- Below the support zone formed by both bottoms
If price breaks below support after a confirmed double bottom candlestick pattern, the setup has failed. There is no reason to stay in the trade. This aligns closely with standard risk management principles used by disciplined forex traders.
Profit Targets Using the Double Bottom Pattern
The most widely used target method is the measured move.
Steps:
- Measure the distance from the bottom to the neckline
- Project that same distance upward from the breakout point
This approach gives realistic targets that align with market structure rather than guesswork. Many traders also evaluate these setups using a clear risk-to-reward ratio before entering the trade.
Many traders scale out:
- Partial profits at the projected target
- Remaining position managed with trailing stops if momentum remains strong
Volume and Indicator Confirmation
While price action alone is enough, confirmation tools improve accuracy in w pattern trading.
Volume and Indicator Confirmation
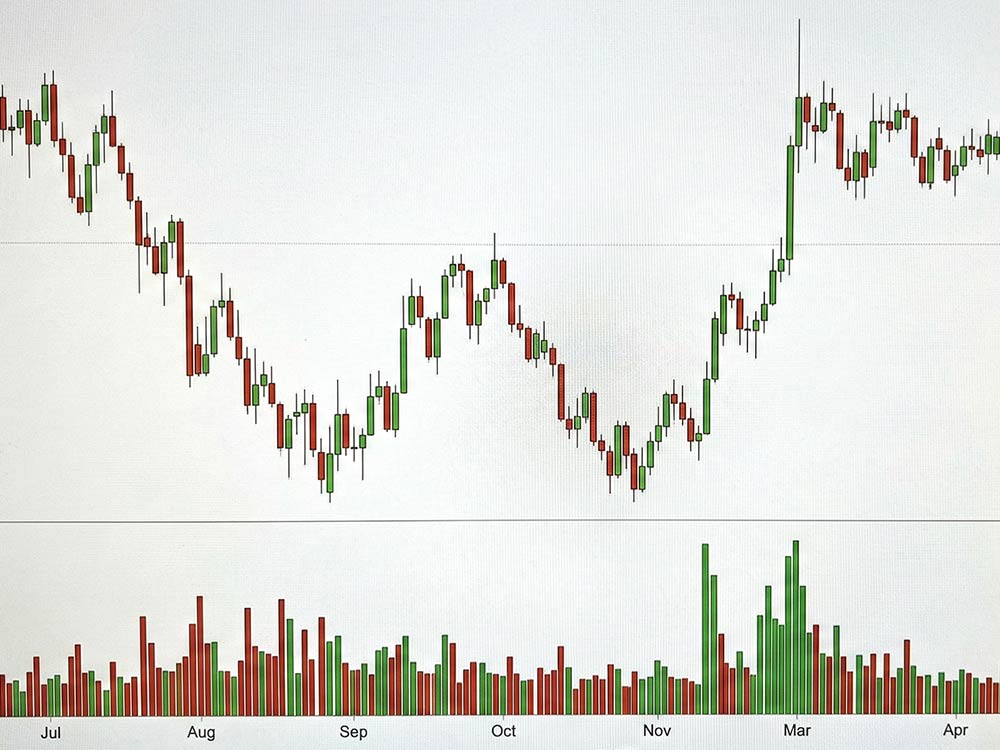
Volume
- Lower volume on the second bottom suggests seller exhaustion
- Higher volume on the breakout supports the w pattern breakout
Momentum Indicators
Indicators such as RSI or stochastic oscillators may show:
- Bullish divergence between the two bottoms
- Momentum breaking resistance alongside price
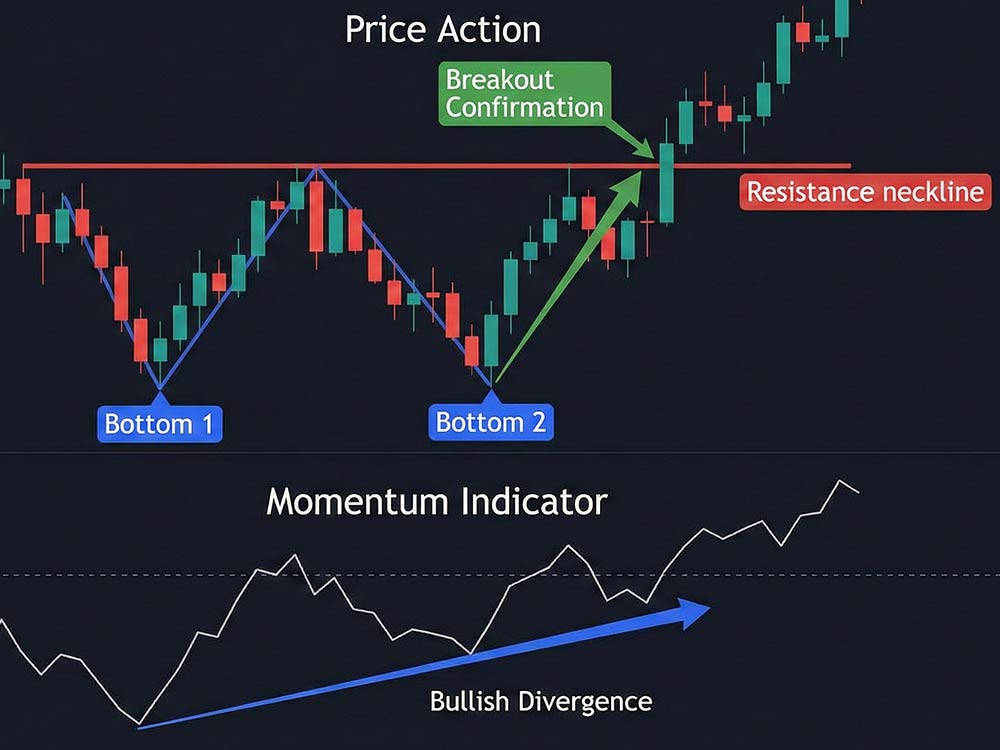
Momentum Indicators
These tools confirm the story price is already telling.
Best Timeframes for the W Chart Pattern
The w chart pattern appears on all timeframes, but reliability increases with higher timeframes.
- Daily and 4H charts: stronger signals, fewer false breakouts
- Intraday charts: more opportunities, more noise
Many traders combine:
- Higher timeframe double bottom pattern for direction
- Lower timeframe structure for precise execution
Common Mistakes in W Pattern Trading
Entering Before the Breakout
Seeing a W shape does not mean a trade exists. Without a confirmed w pattern breakout, the downtrend may continue.
Expecting Perfect Symmetry
Markets are not geometric. The two bottoms rarely match exactly. Focus on behavior, not aesthetics.
Ignoring Market Context
A w chart pattern forming directly into major resistance or during high-impact news is less reliable.
Risking Too Much
Even clean double bottom candlestick patterns fail. Risk management matters more than pattern quality.
W Chart Pattern vs Other Reversal Patterns
Compared to single-bottom reversals, the double bottom pattern is more reliable because it:
- Tests support twice
- Forces sellers to fail publicly
- Attracts momentum traders on the breakout
This is why many traders prefer w pattern trading over aggressive V-shaped reversals.
When the W Chart Pattern Fails
No pattern works all the time. Failures usually occur when:
- The higher timeframe trend is extremely strong
- The breakout lacks volume or follow-through
- External fundamentals override technicals
A failed w pattern breakout often leads to sharp moves in the opposite direction, reinforcing the need for disciplined stops.
Practical Example of a W Chart Pattern
Imagine price in a downtrend:
- Price falls to a support zone and bounces
- It returns to the same zone and rejects strongly
- Price breaks above the neckline with momentum
Measured move projections align with the distance between the bottoms and the neckline, offering a structured plan with defined risk and reward.
This is how traders turn the w chart pattern into a repeatable strategy.
Why the W Chart Pattern Remains Relevant
Markets evolve, but human behavior does not. Fear, hesitation, and confirmation still drive price action. The w chart pattern remains effective because it is built on those universal behaviors.
It does not rely on indicators alone. It waits for proof. And it aligns traders with moments when control clearly shifts from sellers to buyers.
Final Thoughts
The w chart pattern, rooted in the double bottom pattern, is not a shortcut to easy profits. It is a framework for reading market structure and reacting to confirmation instead of emotion.
Used correctly, it helps traders:
- Avoid guessing market bottoms
- Enter trades with confirmation
- Define risk clearly
- Trade reversals with logic
Mastering w pattern trading will not eliminate losses - but it will replace hope with structure. And in trading, that difference is what keeps traders consistent over the long run.
Traders applying the w chart pattern often look for platforms that support clean execution and technical clarity. Forex trading brokers like Dominion Options are commonly used for this style of trading due to its low spreads, fast order execution which makes identifying double bottom structures and managing risk more precise.
FAQ: Double Bottom Pattern
1. Is double bottom bullish or bearish?
The double bottom pattern is bullish. It forms after a decline and shows that sellers failed to push price lower on the second test. A confirmed breakout shifts control to buyers.
2. What does double bottom mean in trading?
In trading, a double bottom means price tested the same support area twice and held. This signals seller exhaustion and rising demand, especially once resistance is broken.
3. What happens after a double bottom pattern?
After a double bottom pattern, price typically moves higher following the breakout. Traders often look for a measured move based on the height of the pattern while keeping risk below support.
4. What confirms a w chart pattern breakout?
A w chart pattern breakout is confirmed when price closes above the neckline with clear momentum. Higher volume and strong bullish candles increase the reliability of the breakout and reduce the risk of false signals.
5. Is w pattern trading reliable for beginners?
W pattern trading can be suitable for beginners because it is structure-based and confirmation-driven. As long as traders wait for the breakout and use proper risk management, the w chart pattern offers a clear and disciplined approach to reversal trading.