
Forex Technical Analysis Basics Every Trading Beginner Should Know
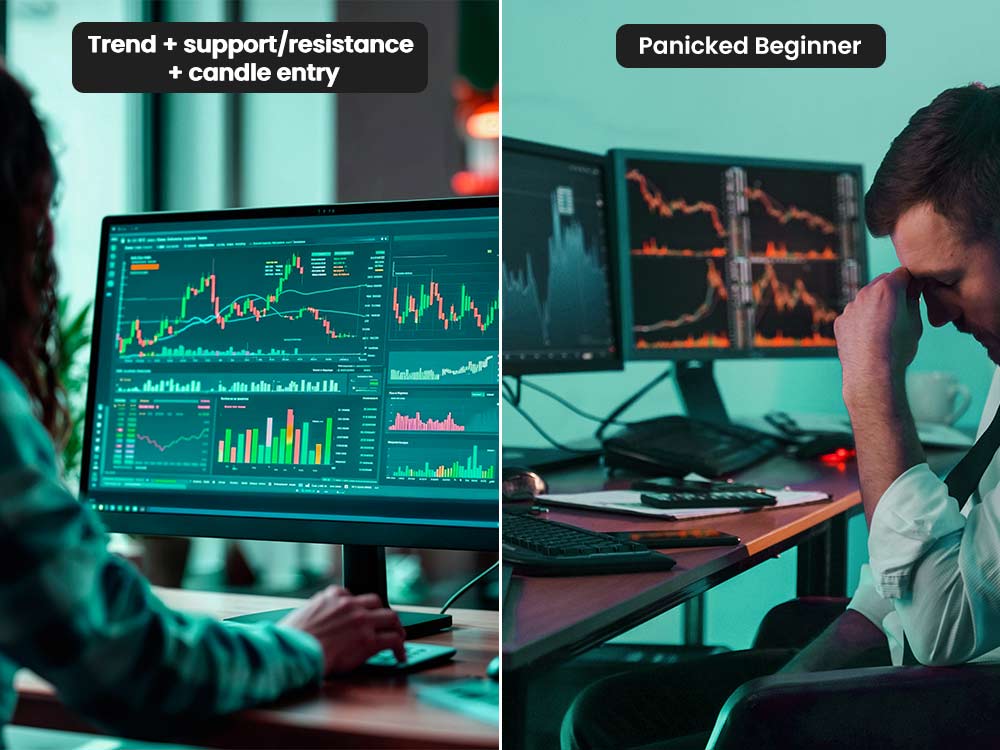
Many new traders jump into the market without a clear process. They react to every move, enter too early, exit too late, and change their mind each minute. This leads to stress, loss, and confusion. One method helps beginners avoid this path. That method is forex technical analysis. It gives structure to each trading choice. It turns guesswork into planned action.
You don’t need to master every tool on your first day. You only need to understand simple ideas that guide your early trades. These ideas help you see trend strength, read price, mark zones, and plan entries that feel calm instead of rushed.
Platforms like Dominion Options make this easier for beginners by offering raw spreads, fast execution, and access to both MT5 and cTrader, giving you flexible tools without overwhelming you from day one.
This guide breaks the basics down in a way beginners can understand and apply forex technical analysis right away.
What Is Technical Analysis in Forex?
Many beginners ask what is technical analysis in forex and why traders use it so often. The idea is simple. You study price on a chart to understand buyer and seller behavior. You use past price to judge what may happen next.
You don’t need news or reports to do this. You focus on the chart alone.
Forex technical analysis helps you:
- avoid trades with weak signals
- wait for clean setups
- stop chasing price
- act on proof
- stay calm during moves
You won’t predict the exact future. No tool can do that. But you can make choices with better odds when you follow clear signs on the chart.
Why Technical Analysis Helps Beginners Trade With Less Stress
Why Technical Analysis Helps Beginners Trade With Less Stress
Many beginners enter the market with fear or excitement. Both emotions lead to poor judgment. A structured method reduces this pressure. Forex trading technical analysis gives you a simple plan. When you follow the price instead of guessing, you feel more relaxed.
Beginners gain these benefits With Technical Analysis:
- a clearer view of trend direction
- safer areas to enter
- zones to avoid
- better stop placement
- smarter targets
- less emotional trading
Over time, this builds confidence. You stop making random choices. You start making planned ones, which is a critical shift when applying consistent forex trading strategies that prioritize clarity and risk control.
How to Read Forex Charts as a Beginner
Before you can use forex market technical analysis, you must know how to read forex charts. Charts show how price behaved over time. Each movement tells a story about strength or weakness.
Start with these basics:
- Look for clean waves up or down.
- Avoid charts with random swings.
- Mark areas where price reacts often.
- Watch how candles form at these areas.
Your goal is to see the bigger picture first. Many beginners jump straight into lower timeframes. This creates noise and confusion. Instead, start with higher timeframes. They show clean direction and help you avoid messy trading periods.
Example: Gold/USD Trade Breakdown
Gold/USD Trade Breakdown
Let’s walk through a real example using technical analysis on XAU/USD (Gold vs US Dollar):
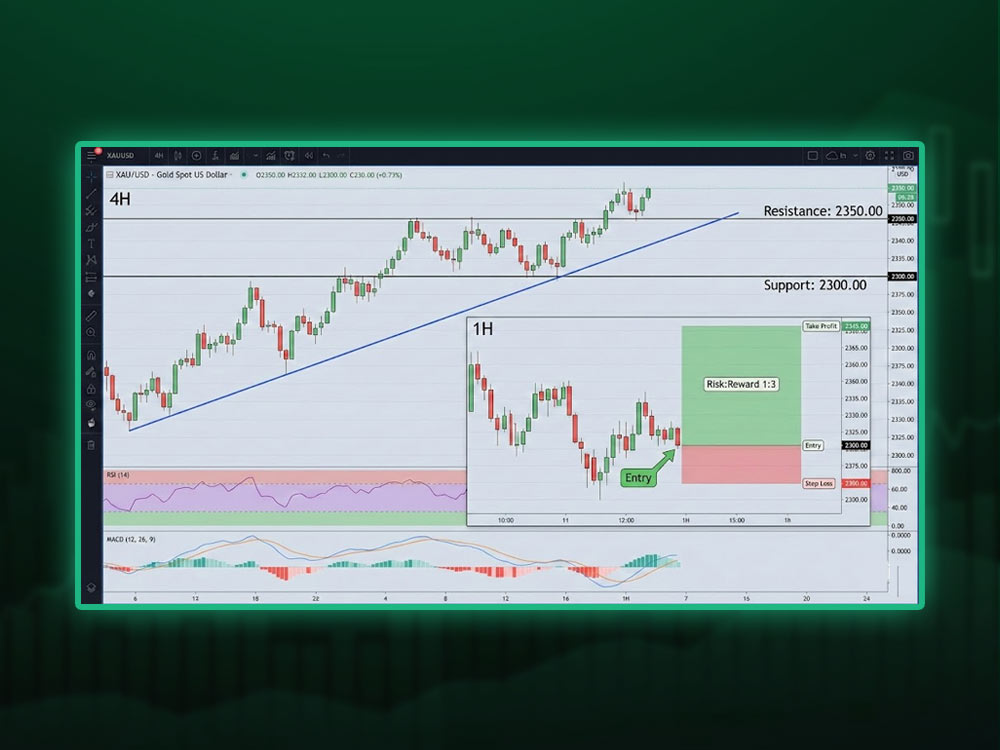
1. Identify Trend on Higher Timeframe: On the 4-hour chart, price is making higher highs and higher lows. This confirms an uptrend.
2. Mark Support and Resistance Zones: Support zone found around 1932.00 where price previously bounced twice. Resistance around 1984.00 where price was rejected three times.
3. Drop to Lower Timeframe (1-hour): Price pulls back to the 1932.00 support and forms a bullish engulfing candle with RSI bouncing above 40. This shows momentum is returning.
4. Check Confluence:
- 50-period moving average is right under the 1932.00 zone
- RSI rising
- MACD crossover about to happen
- Clean structure and clear trend
5. Entry and Risk Plan:
- Entry: 1935.00 (after candle close above zone)
- Stop Loss: 1924.00 (below previous swing low and zone)
- Take Profit: 1965.00 (inside previous resistance range)
- Risk: Reward = roughly 1:3
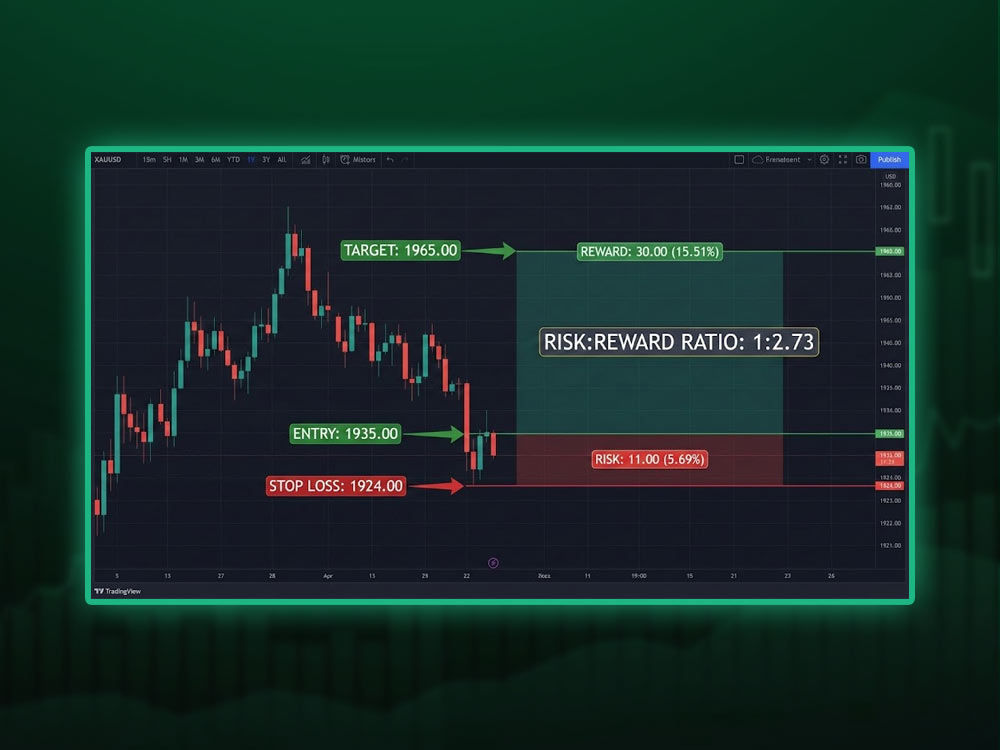
Risk: Reward = roughly 1:2.73
6. Execution: Wait for candle confirmation, no rush. Entry is only valid after the breakout candle closes with conviction.
This type of setup blends clean structure, confirmation, and logic - the core of any solid technical trade and a strong foundation for building a consistent xau/usd trading strategy that aligns with trend and momentum.
Spotting Trends in Forex Technical Analysis
Trend reading is the main skill in forex technical analysis. Trends show the general direction of the market.
Three main types:
Uptrend
Price makes higher highs and higher lows.
Downtrend
Price makes lower lows and lower highs.
Range
Price moves sideways between two zones.
Beginners often try to catch tops or bottoms. This leads to fast losses. A safer method is to trade with the trend.
- In an uptrend, look for buys.
- In a downtrend, look for sells.
- In a range, wait for clean setups near the edges.
When trend waves get smaller or slow down, the market may shift. This helps you avoid entering late.
Support and Resistance: The Most Important Zones
Support and Resistance: The Most Important Zones
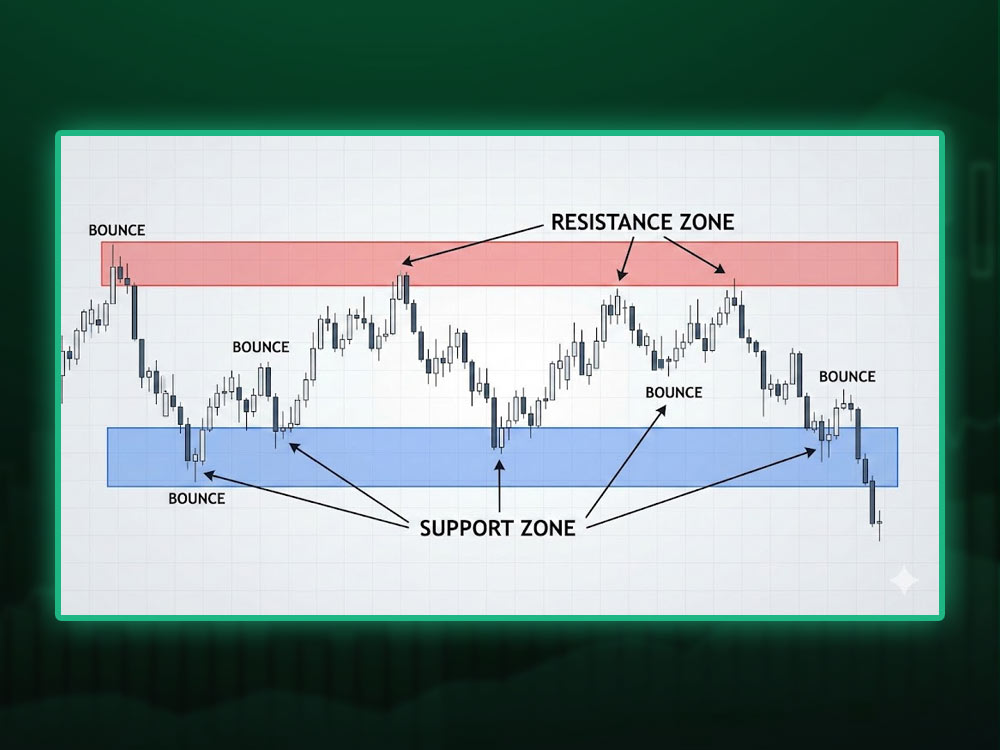
Support and resistance zones guide almost every trading plan.
Support is a floor where buyers step in. Resistance is a ceiling where sellers step in.
These areas help you:
- avoid entering into heavy pressure
- plan safer stop loss spots
- choose smart take profit levels
- avoid emotional decisions near key zones
Mark only strong zones. Too many lines will confuse you.
Good rule: if price reacts many times in one area, it’s a strong zone. You can also use tools like the best support and resistance indicators to make zone detection easier and more accurate.
How to Read the Candlestick Chart in Forex Trading
Candlesticks show how price behaved during each period. Learning how to read the candlestick chart in forex trading helps you judge strength or weakness at a glance.
Key signals to learn:
- Strong bullish candles show buyer pressure.
- Strong bearish candles show seller pressure.
- Long wicks show rejection.
- Inside candles show slow movement.
Your goal is not to memorize every pattern. Focus on how candles behave at strong zones. A good candle at a smart spot is more powerful than a fancy pattern in the wrong place.
Basic Chart Patterns Beginners Should Know
Chart patterns help you understand where price may move next. Start with three easy patterns:
1. Double Top
Shows two failed tries to break resistance. May lead to a drop.
2. Double Bottom
Shows two failed tries to break support. May lead to a rise.
3. Breakouts
Price pushes through a zone with strength. The move may continue.
Avoid using patterns on messy charts. They work best when the trend is clean. To build a stronger foundation, study forex trading chart patterns that traders rely on across market conditions.
How to Do Technical Analysis in Forex Using Moving Averages
Moving averages smooth price and show direction. They help beginners follow the trend without confusion.
Common ones:
- 50-period
- 200-period
They help you:
- spot trend
- find dynamic support or resistance
- judge momentum
If price stays above the 50 line, buyers often have control. If price stays below, sellers often have control.
Use moving averages as guidance. Never use them alone.
RSI: A Simple Way to Judge Strength
RSI tells you if price moves with strong or weak momentum. It helps beginners avoid emotional trades.
Key zones:
- Above 70 often means strong upward pressure.
- Below 30 often means strong downward pressure.
But these zones do not guarantee reversals. Many beginners assume that price must turn. This leads to early entries. Instead, use RSI to support your idea, not create it.
MACD for Extra Confirmation
MACD helps you see shifts in momentum.
- When the MACD line crosses above the signal line, momentum may rise.
- When it crosses below, momentum may fall.
Use MACD with trend and support zones, not alone.
Smart Entry and Exit Basics for Beginners
A good trade starts with a calm entry. A poor entry starts with pressure and doubt.
Use these rules for better entries:
- enter near support or resistance
- follow the trend
- wait for a clean candle signal
- make sure there is room for profit
- avoid entering in the middle of a range
Exits also need a plan:
- place stops outside noise
- take profit at strong zones
- avoid shifting stops out of fear
- exit early only when the setup breaks
Learning how to time your entry and exit makes all the difference, see our breakdown on finding the best entry and exit in forex for practical tips.
Risk Management: The Core of Every Trading Plan
No level of forex technical analysis will save a trade if your risk is unsafe. Most new traders lose because they risk too much.
Safer ideas:
- Risk small per trade.
- Keep stops smart and clear.
- Avoid wide stops.
- Avoid tight stops that fail fast.
- Plan every trade before entering.
Many stick to 0.5% to 1% risk per trade. Large risk destroys accounts fast. This is why having a solid approach to forex risk management is essential from the start.
Common Technical Analysis Mistakes Beginners Make
Common Technical Analysis Mistakes Beginners Make
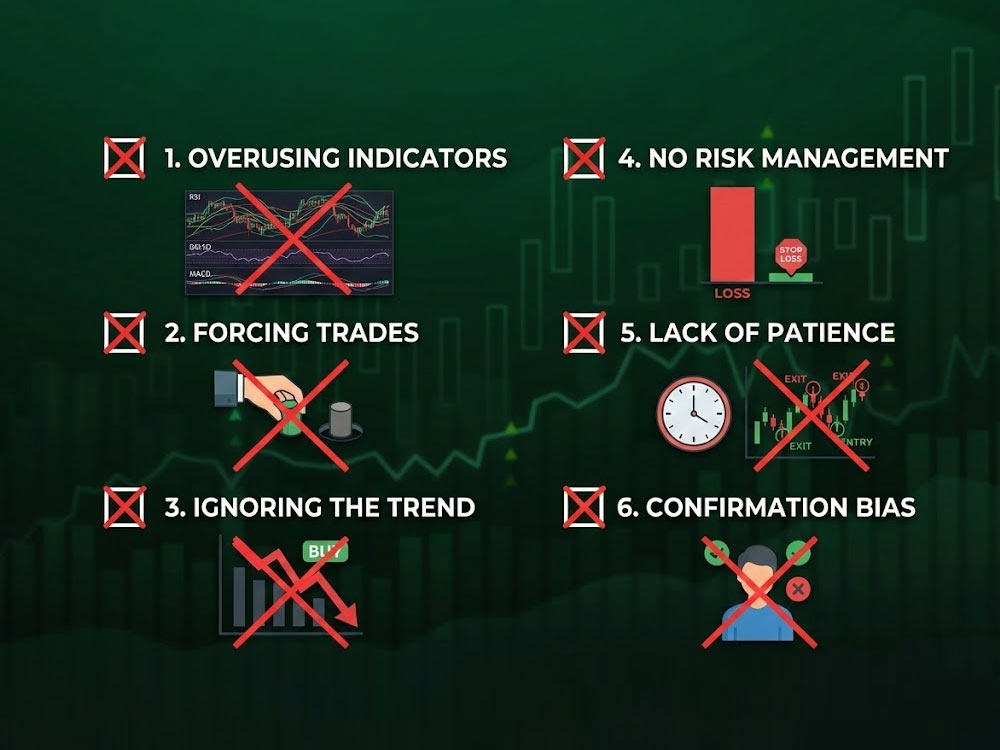
Beginners often repeat the same mistakes:
- They add too many forex indicators.
- They trade on low timeframes too soon.
- They force trades without clean setups.
- They ignore the main trend.
- They chase breakouts without waiting for proof.
- They break their own rules mid-trade.
Trading becomes clear when you remove clutter and follow simple rules.
A Simple Routine for Daily Technical Analysis
Here is a beginner-friendly plan to practice with:
- Start on a higher timeframe.
- Mark your trend.
- Mark strong support and resistance zones.
- Move to a lower timeframe.
- Look for a clean candle signal.
- Check momentum tools.
- Choose your stop and target.
- Enter only when price confirms your plan.
Practice this until it feels natural.
Final Thoughts
Forex technical analysis gives beginners structure and confidence. You don’t need complex tools. You don’t need to predict the future. You only need a clear method, clean charts, and steady habits.
Over time, you will see price differently. Trends make sense. Zones feel clear. Candles tell stories. Platforms like Dominion Options help make this clarity possible with raw spreads from 0.1 pips, fast execution, and support for both cTrader and MT5. If you're looking for a reliable environment to grow, they're a strong option for anyone searching for the best forex broker.
FAQs: Forex Trading Technical Analysis
1. How do I start using forex technical analysis the right way?
Start with trends, zones, and candles. Keep your chart clean. Avoid using too many indicators. Build a simple routine and follow it daily.
2. Is forex trading technical analysis better than news trading?
Both methods work, but beginners find chart-based trading easier and calmer. Technical analysis gives clear signals without heavy stress.
3. How do I learn how to read forex charts fast?
Focus on waves, key levels, and simple candles. You don’t need complex tools. Clean charts help you learn faster.
4. Can I use forex market technical analysis alone?
Yes, many traders rely on chart reading only. The key is to follow a clear plan and use proper risk management.
5. How can I learn how to do technical analysis in forex step by step?
Study trend, zones, candles, and simple indicators. Then follow a daily routine that repeats the same steps. Repetition builds skill.