Best Indicators for Intraday Trading to Spot Clean Setups
Intraday trading moves fast. Price shifts in minutes. You must act with a plan. Clean setups matter because they help you avoid noise and focus on strong moves. A clear chart with the best indicators for intraday trading gives you structure so you can take better trades.
Many new traders guess. They chase candles. They enter too late and exit too early. A better approach is to use simple tools that guide your choices. These tools show trend, strength, speed, and zones that matter. When you follow them, your trades feel calm and controlled, especially when you trade with a broker you trust. This is why many intraday traders join Dominion Options, since stable spreads and smooth fills help these setups work better.
This guide explains what are the best indicators for intraday trading and how each one works. You will also see why these tools help you spot clean setups in stocks, crypto, and even best indicators for intraday trading forex pairs. The goal is to give you clear steps you can trust each day.
Why You Need Indicators for Intraday Trades
Intraday trades open and close within one session. You face sharp moves, noise, and fake breakouts. Good indicators point you toward:
- Trend
- Momentum
- Volatility
- Strength
- Weak spots
- Entry and exit points
The best indicators for intraday trading help you avoid random trades. They give order to a messy chart.
You still need stops. You still need to take a small risk. But these indicators guide your decisions while day trading forex.
1. Moving Averages: The Base of Every Clean Chart
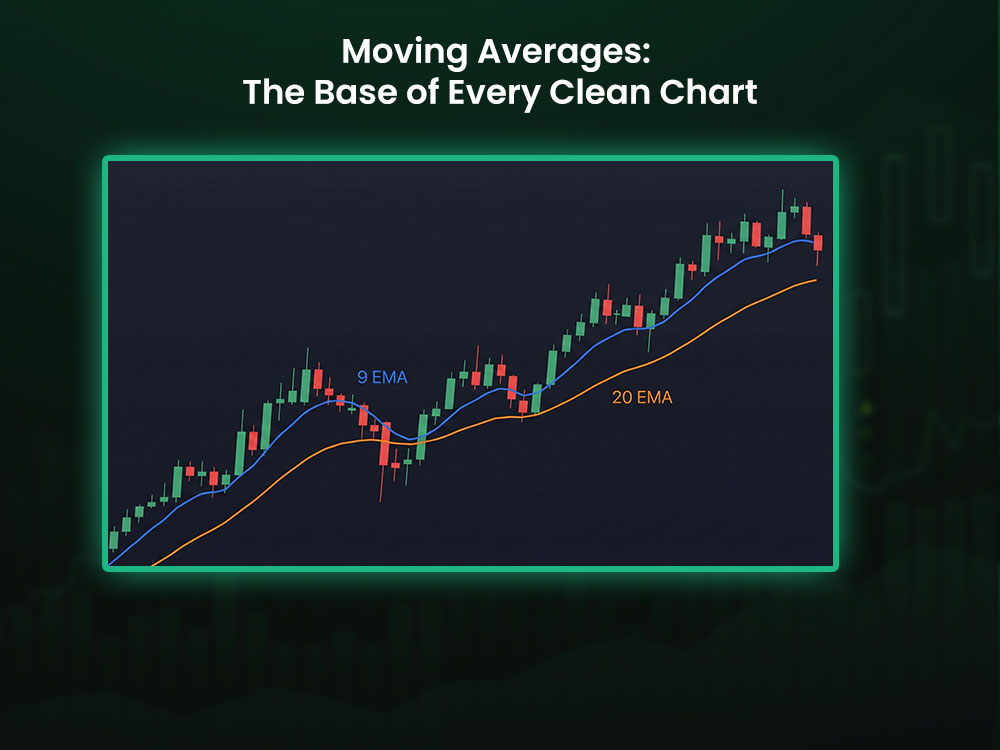
Moving Averages: The Base of Every Clean Chart
Moving averages smooth prices so you can see trend direction. They remove noise. They also act like dynamic support and resistance.
Most intraday traders use a Simple Moving Average (SMA) or an Exponential Moving Average (EMA). EMAs react faster and help you catch clean setups.
Because of this, EMAs are seen as one of the best indicators for intraday trading across all markets.
Why Moving Averages Work
- They show the true trend
- They filter noise
- They mark pullback zones
- They help spot strong moves
If price stays above the 9 EMA or 20 EMA, buyers control the chart. If price stays below, sellers lead.
How to Use Moving Averages
1. Follow the slope.
Up slope = long trades.
Down slope = short trades.
2. Look for pullbacks to the EMA.
Clean setups form when price drops to the EMA and then bounces back with strength.
3. Skip flat moving averages.
Flat lines show a range. Ranges kill clean setups
Simple Moving Average Setup
- Add the 9 EMA and 20 EMA
- Trade in the direction of both
- Enter during a small pullback
- Keep a tight stop under the swing
This is one of the cleanest ways to apply the best indicators for intraday trading forex pairs too.
For deeper chart guidance, you can also study the Forex Technical Analysis guide on Dominion Options.
2. RSI: A Straightforward Momentum Tool
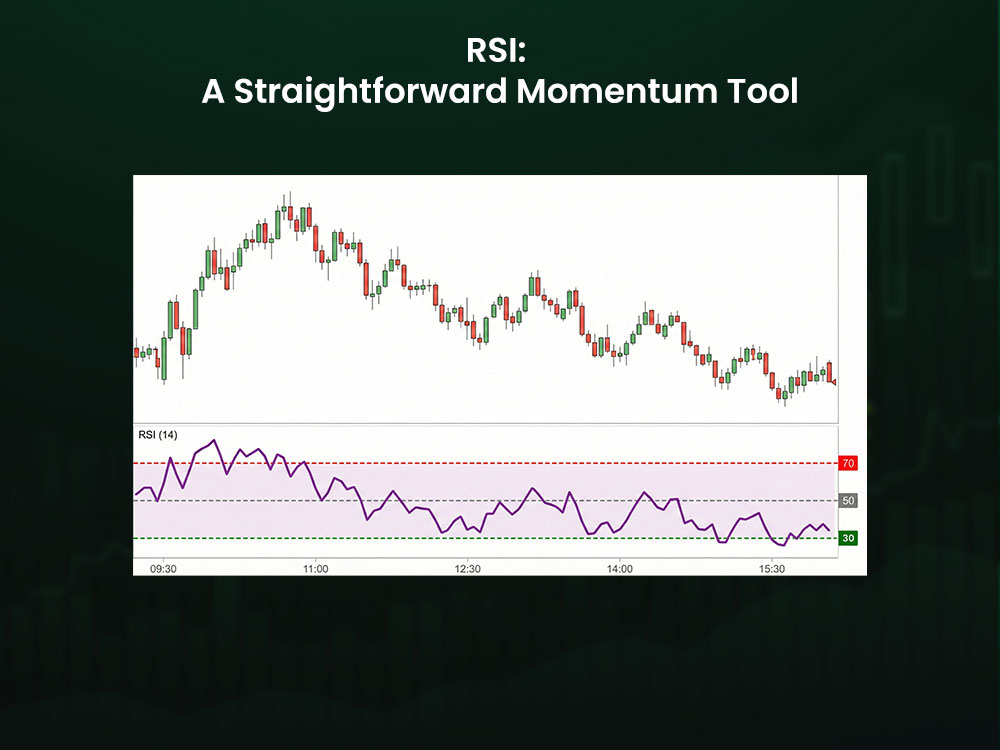
RSI: A Straightforward Momentum Tool
RSI means Relative Strength Index. It measures the speed of price changes. It ranges from 0 to 100.
- Over 70 shows strong buying
- Under 30 shows strong selling
But intraday traders use RSI more for momentum than reversals. It is a simple but powerful part of the best indicators for intraday trading group.
Why RSI Helps
- It confirms trend strength
- It shows when a move loses power
- It warns you about weak breakouts
- It filters bad setups
How to Use RSI
1. Check RSI with the trend.
If trend is up and RSI stays above 50, strength is real.
2. Avoid breakouts with weak RSI.
If price pumps but RSI stays flat, skip the trade.
3. Do not rely on RSI for reversals alone.
Strong trends keep RSI high or low for long periods.
RSI Trick for Intraday Timeframes
Watch the 40–60 zone.
- Uptrend → RSI stays above 40
- Downtrend → RSI stays below 60
If RSI breaks this zone, momentum shifts. This simple trick makes RSI one of the best indicators for intraday trading forex charts too.
If you want to explore more tools like RSI, the Best MT5 Indicators for Trading article gives simple options you can test right away.
3. MACD: Clean Signals for Trend and Power
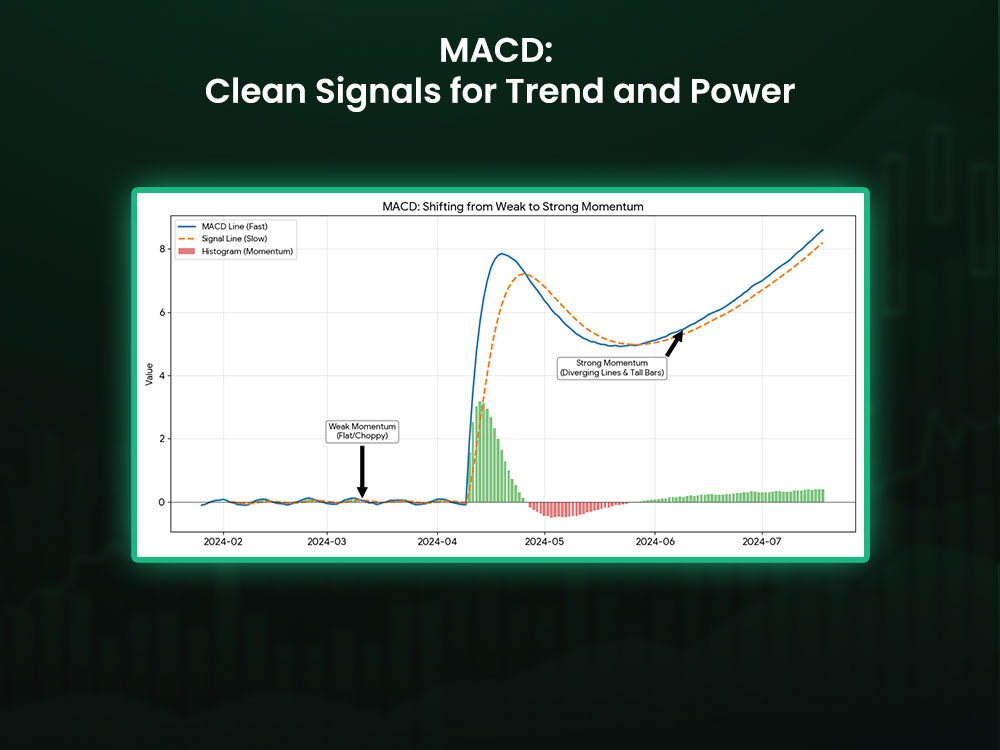
MACD: Clean Signals for Trend and Power
MACD stands for Moving Average Convergence Divergence. It uses EMAs to show strength and trend shifts.
MACD has:
- The MACD line
- The Signal line
- A Histogram
The histogram shows momentum. When bars rise, the trend gains power. When bars shrink, momentum slows.
Why MACD Helps
- It shows trend shifts early
- It confirms strong moves
- It helps filter noise
- It gives clean momentum waves
This makes MACD one of the best indicators for intraday trading when you want high-confidence signals.
How to Use MACD
1. Look for crosses.
MACD crossing up = buyers gain strength.
MACD crossing down = sellers gain strength.
2. Watch histogram bars.
Growing bars show power.
Shrinking bars show a slowdown.
3. Combine MACD with trend lines.
MACD should confirm your price action plan.
MACD Setup
- Check for a clear trend with EMAs
- Wait for a pullback
- Check for MACD bars turning back with the trend
- Enter when trend resumes
You can pair MACD setups with the concepts found in Best Support and Resistance Indicators guide for stronger confirmation levels.
4. Bollinger Bands: Clear Zones for Breakouts and Reversals
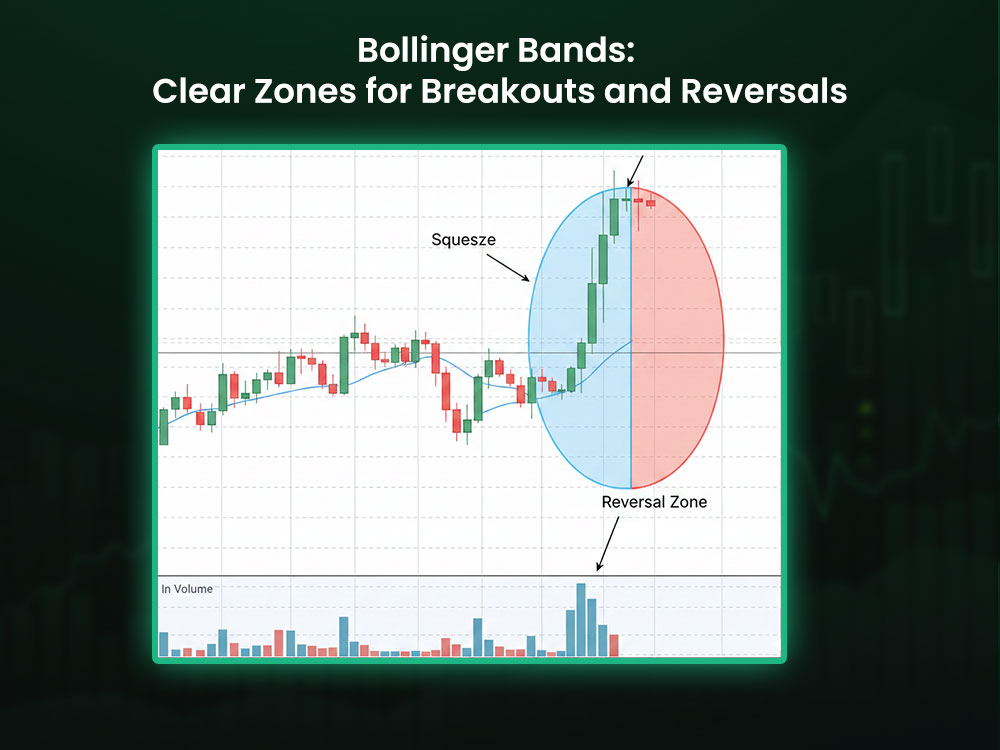
Bollinger Bands: Clear Zones for Breakouts and Reversals
Bollinger Bands track volatility. They include:
- A middle SMA
- An upper band
- A lower band
Bands widen when price explodes. Bands shrink when price slows.
Why Bollinger Bands Work
- They show extreme zones
- They help spot breakouts
- They show clean pullback points
- They highlight volatility shifts
This makes Bollinger Bands one of the best indicators for intraday trading, especially during fast markets.
You can also test this with ideas from the Supertrend Indicator guide, which helps track trend strength.
How to Use Bollinger Bands
1. Use the bands as zones.
Upper band = strong buying
Lower band = strong selling
2. Watch for band squeezes.
A squeeze means low action. Breakouts often follow.
3. Avoid chasing candles outside the band.
Many of these moves fail.
Bollinger Band Setup
- Wait for a squeeze
- Look for price closing outside a band
- Enter only if the next candle confirms
This setup works well in stocks and best indicators for intraday trading forex charts.
5. VWAP: The Volume Line Big Traders Watch
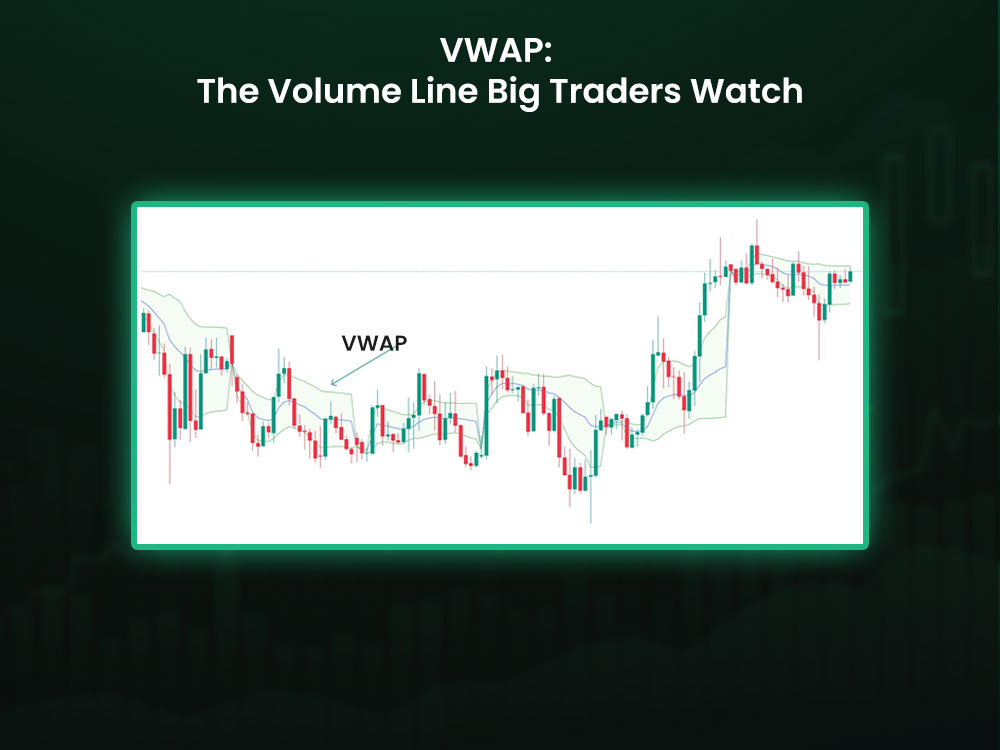
VWAP: The Volume Line Big Traders Watch
VWAP means Volume Weighted Average Price. It shows the average price buyers and sellers paid that day. Many funds use it, which makes it very strong.
Why VWAP Helps
- Shows fair price
- Acts as firm support or resistance
- Confirms trend strength
- Filters weak moves
VWAP is often seen as one of the best indicators for intraday trading for day traders who want clean setups.
How to Use VWAP
1. Follow the side of the VWAP.
Above VWAP → buyers lead
Below VWAP → sellers lead
2. Use VWAP as a pullback zone.
Price often bounces there.
3. Avoid VWAP chop.
When price crosses VWAP too much, stay out.
VWAP Setup
- Wait for price to break VWAP
- Let price pull back
- Enter on a bounce
- Place stop under the pullback candle
For a strategy-first angle, check the Forex Trading Strategies guide, which shows simple plans you can use with VWAP setups.
6. Stochastic: Quick Swings in Ranges
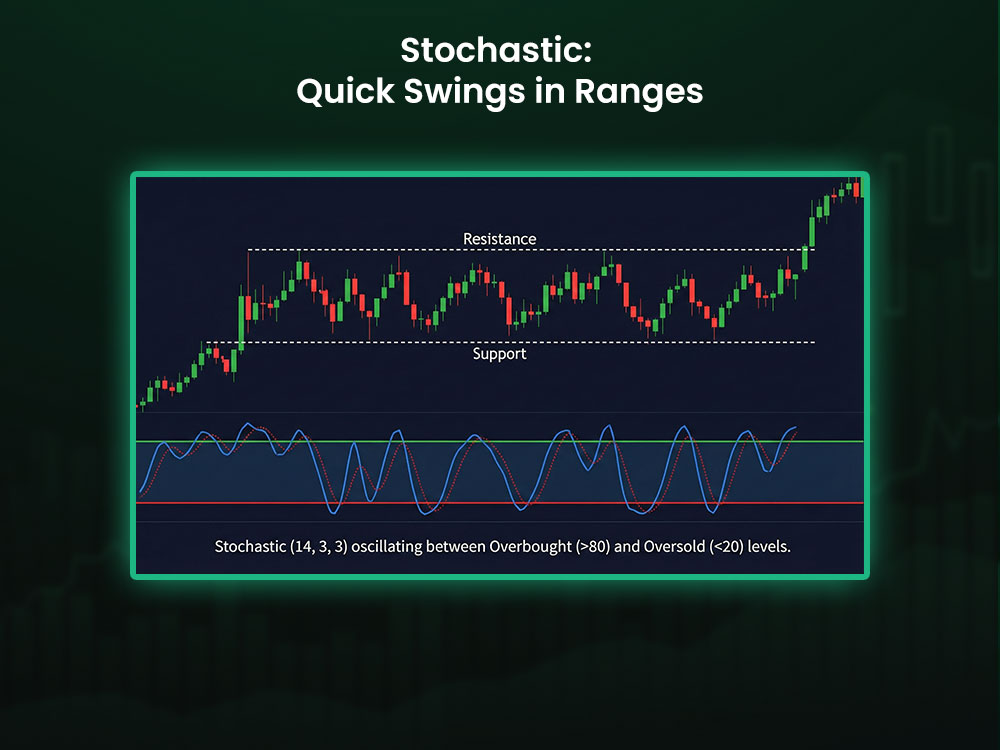
Stochastic: Quick Swings in Ranges
Stochastic is a fast oscillator. It compares the close to the recent range. It moves between 0 and 100.
- Above 80 → stretched
- Below 20 → weak
This tool works best in ranges, not strong trends.
Why Stochastic Helps
- Shows clear swings
- Helps catch short moves
- Warns you about stretched price
- Helps avoid top and bottom traps
How to Use Stochastic
1. Look for crosses in extremes.
Cross down from above 80 = short
Cross up from below 20 = long
2. Skip stochastic in strong trends.
Stochastic Range Setup
- Find a range
- Wait for price to hit support or resistance
- Enter when stochastic crosses
Stochastic adds extra clarity when picking the best indicators for intraday trading in tight markets.
You can improve Stochastic setups by reading about Scalping Strategies on MT5, which rely on fast swings.
7. CCI: Precise Momentum Bursts
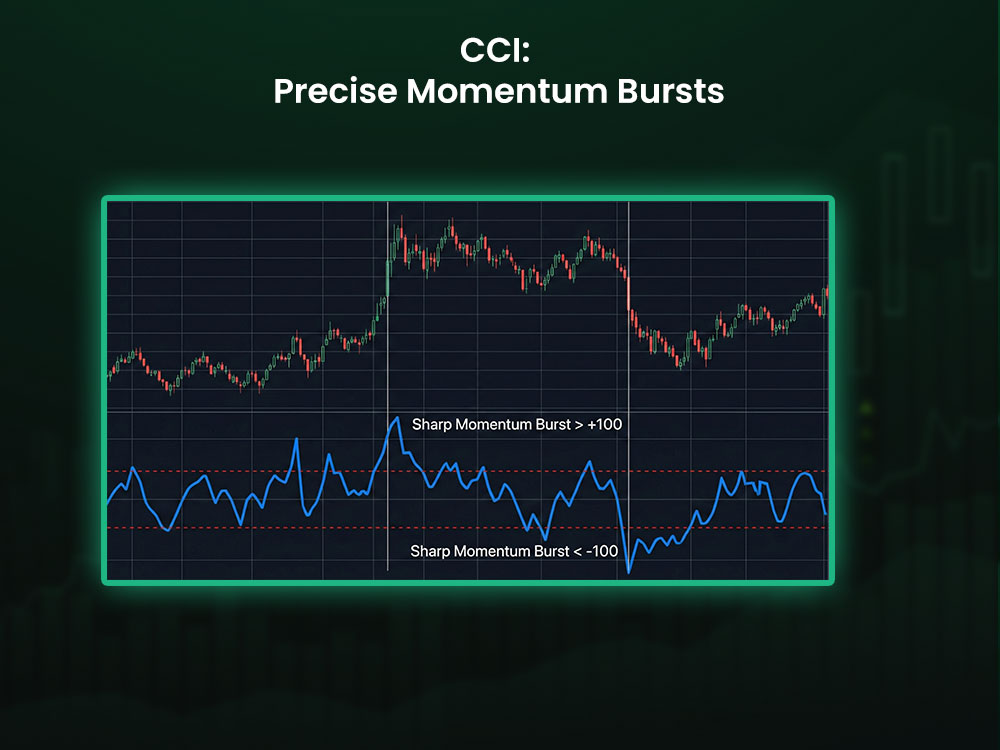
CCI: Precise Momentum Bursts
CCI means Commodity Channel Index. It shows how far price shifts from its average. It reacts fast, which helps intraday traders.
Why CCI Helps
- Spots sharp bursts
- Shows clean shifts
- Helps catch breakout moves
- Filters weak setups
How to Use CCI
1. Use +100 and -100 zones.
Above +100 = strong buying
Below -100 = strong selling
2. Watch for crosses back through these levels.
When CCI moves back through +100 or -100, it can mark a shift.
This makes CCI a strong part of the best indicators for intraday trading.
8. Volume: Strength You Must Not Ignore
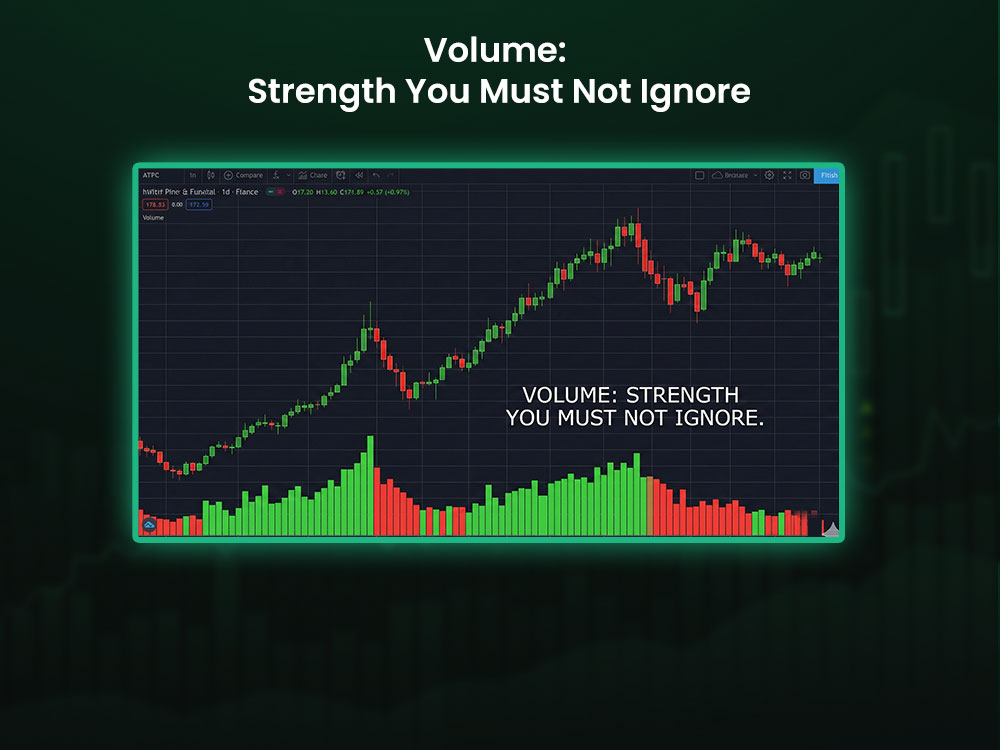
Volume: Strength You Must Not Ignore
Volume is not fancy, but it reveals the truth. Many traders skip it, yet it may be the most honest tool on your chart.
Why Volume Matters
- Shows real strength
- Confirms or rejects breakouts
- Shows when a pullback is safe
- Helps spot traps
How to Use Volume
1. Rising volume in trend direction = strong move
2. Falling volume on pullbacks = safe trend
3. Breakouts with low volume = skip
Volume plays a big role in the best indicators for intraday trading forex pairs as well, and you can pair this with the Best Risk‑to‑Reward Ratio in Forex guide to plan cleaner entries. Even though spot FX does not show full exchange volume. Many traders use tick volume instead.
How to Combine the Best Indicators for Intraday Trading
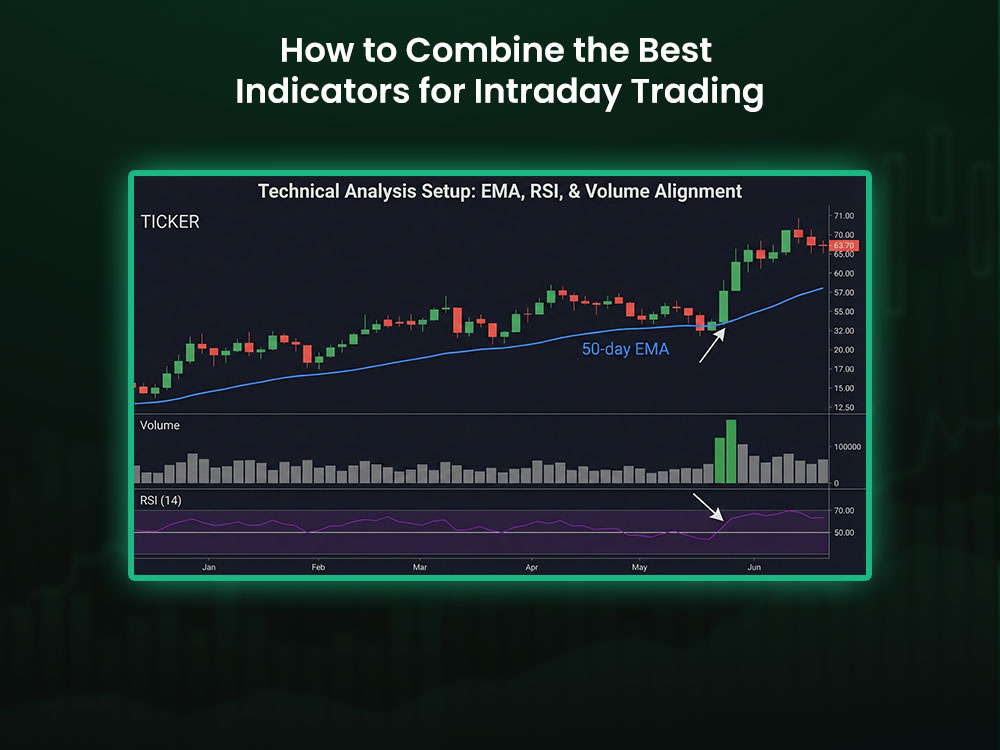
How to Combine the Best Indicators for Intraday Trading
The best setups use a small mix of tools. Too many indicators slow you down. You need a clean chart and clear rules.
Three-Indicator Clean System
Use:
- EMA for trend
- RSI for momentum
- Volume for strength
How It Works
- Check EMAs for trend.
- Check RSI to confirm momentum.
- Check volume for strength.
- Wait for a controlled pullback.
- Enter when price moves back with fresh volume.
Why This Works
- Trend confirmed
- Strength confirmed
- Momentum confirmed
This simple mix answers what are the best indicators for intraday trading with strong results across all markets.
You can sharpen this system even more by learning from the Stop Loss in Forex Trading guide.
Common Mistakes Traders Make
1. Using too many tools
It causes noise.
2. Fighting the trend
Trends win.
3. Taking every signal
Signals need context.
4. Skipping volume
Volume confirms truth.
5. Trading news spikes
Everything breaks during news.
Final Thoughts
Clean setups come from clear signals. When you use the best indicators for intraday trading, you cut out noise and follow simple rules. Trend, momentum, and volume matter. When they line up, the trade is clean. When they do not, you wait.
This is how you gain control. This is how you spot clean setups with confidence every day, especially when you trade with a broker like Dominion Options that offers raw spreads, smooth execution, and stable conditions for intraday moves.
FAQs: Best Indicators for Intraday Trading
1. What are the best indicators for intraday trading?
The best ones are EMAs, RSI, MACD, VWAP, Volume, Bollinger Bands, CCI, and Stochastic. These tools show trend, momentum, strength, and volatility with simple rules.
2. Are these the best indicators for intraday trading forex?
Yes. EMAs, RSI, MACD, and Bollinger Bands work well on forex pairs. Tick volume also helps confirm strength.
3. Should I use many indicators?
They are simple once you understand how price forms shapes. With practice, you will see them fast.
4. Which indicator is best for beginners?
Start with EMAs, RSI, and Volume. They are simple and reliable.