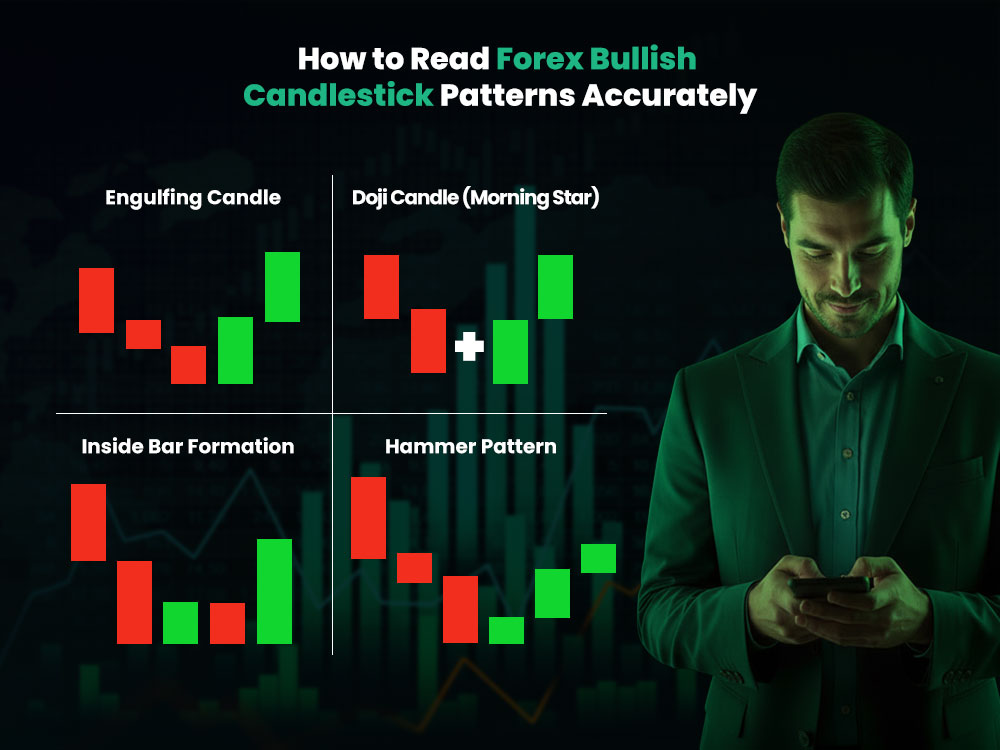
How to Read Forex Bullish Candlestick Patterns Accurately
Understanding forex bullish candlestick patterns is one of the most valuable skills in trading. These visual signals help traders see when buyers might take control after a downtrend.
When read correctly, bullish candlestick patterns can guide you toward high-probability entries and smarter exits. On platforms like Dominion Options, traders rely on these same setups to spot early reversals, plan better entries, and manage trades with precision
Let’s explore how to read these patterns accurately without complicating things.
What Are Forex Bullish Candlestick Patterns?
What Are Forex Bullish Candlestick Patterns
A forex bullish candlestick pattern shows when buyers start gaining ground. Each candle displays the open, close, high, and low for that session. If the close is higher than the open, the candle appears green or white, meaning buyers were stronger.
Sometimes a single candle shows this change. Other times, several candles combine to form patterns that hint at reversals or continuations. Traders watch them to find points where demand may return after selling pressure.
Because forex prices move quickly, these patterns give clues about changing sentiment before most indicators do.
If you want to see how this idea works in real setups, check out our article about bullish pin bar candlestick pattern. It shows how traders on Dominion Options spot pin bars forming at key levels to confirm early buyer strength and refine their entries.
Why Bullish Candlestick Patterns Matter in Forex Trading
Forex prices react to news, rates, and market emotion. Every candle reflects the tug-of-war between buyers and sellers. Bullish candlestick patterns in forex setups show when the balance starts to tilt toward buyers.
When they appear near the bottom of a fall, it can mean sellers are running out of strength. Reading forex bullish candlestick charts clearly helps you spot reversals early instead of chasing after big moves.
How to Read a Bullish Candlestick Pattern Correctly
How to Read a Bullish Candlestick Pattern Correctly
Reading bullish candlestick patterns well depends on context. Here’s a simple process:
- Identify the trend: A bullish signal carries more weight after a drop than during an uptrend.
- Check the candle shape: The body shows control; wicks mark rejection. A long lower wick often means buyers stepped in firmly.
- Wait for confirmation: The candle following a pattern must close higher to confirm reversal strength.
- Check volume: Rising tick volume supports a valid bullish move.
- Consider timeframes: Higher-timeframe forex bullish candlestick patterns are more reliable than those on lower charts.
When all these conditions align, the pattern has real trading value. To refine your entry and exit, see our article about best times to trade forex.
The Most Common Forex Bullish Candlestick Charts
Below are the bullish candlestick charts that forex traders rely on most. Each signals means that buyers may be taking control after a sell-off.
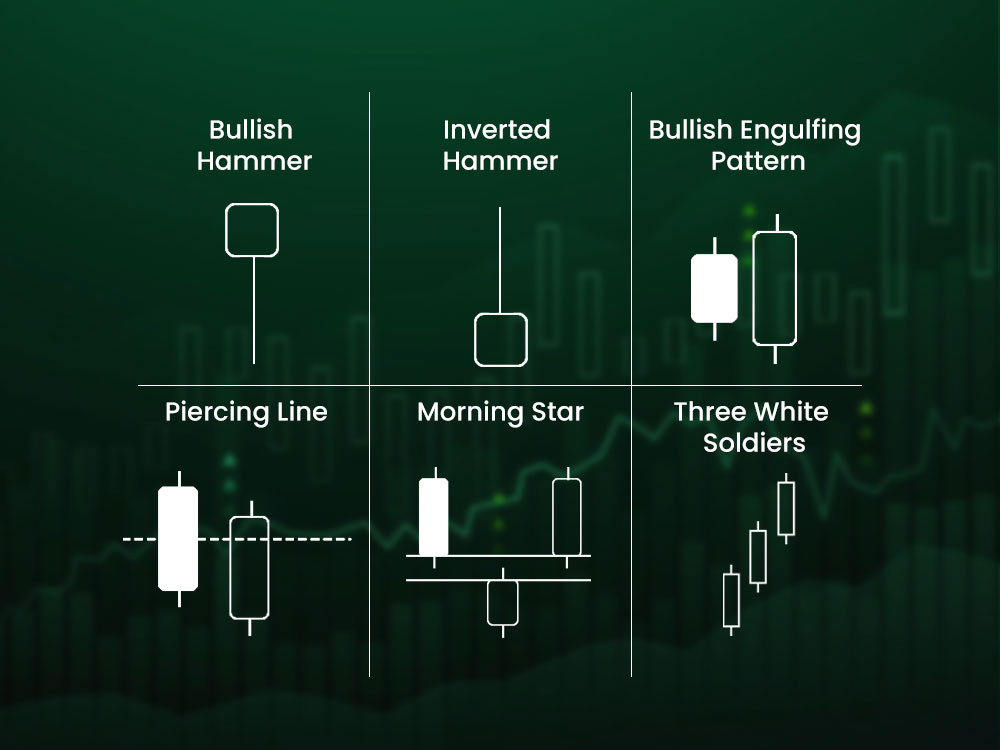
1. Bullish Hammer
Bullish Hammer
A hammer appears after a downtrend. It has a short body near the top and a long lower shadow. The lower wick should be at least twice the body length. This pattern shows sellers pushed prices down, but buyers fought back hard.
When a bullish hammer candlestick forms at a support zone, it often marks a potential bottom. Traders usually wait for the next candle to close above the hammer’s high before buying.
2. Inverted Hammer
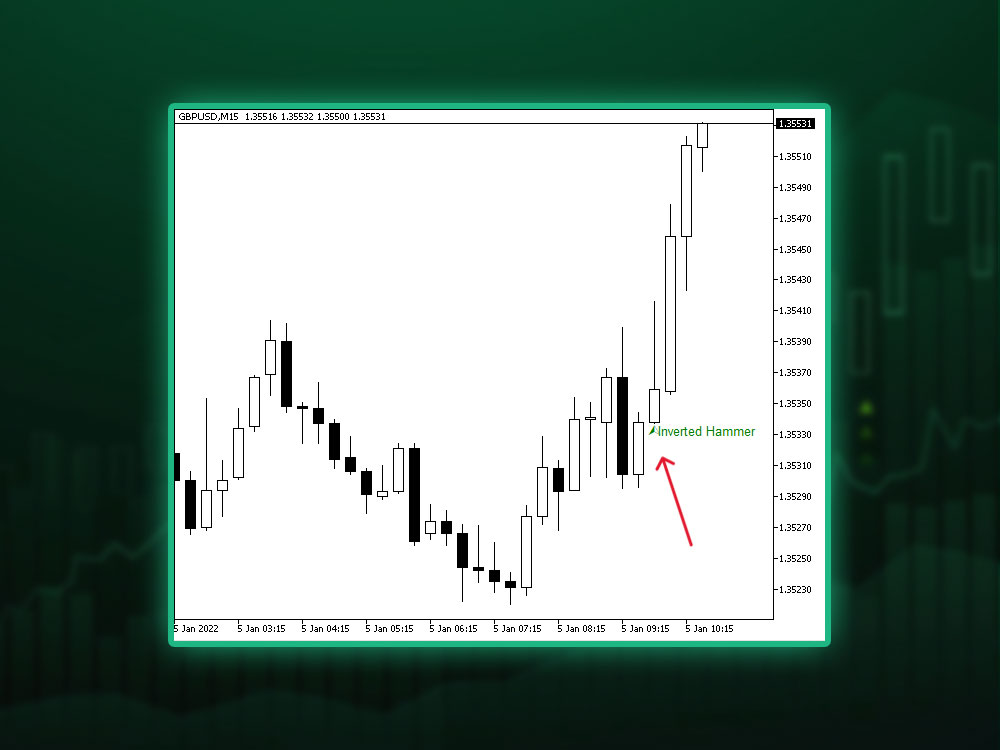
Inverted Hammer
An inverted hammer forms after a price drop. It has a small body and a long upper wick. This shows buyers tried to push higher but met resistance. If the next candle closes above the wick’s high, it often signals buyers gaining control. It’s not as strong as a normal hammer but can still mark a change when it appears near support.
3. Bullish Engulfing Pattern
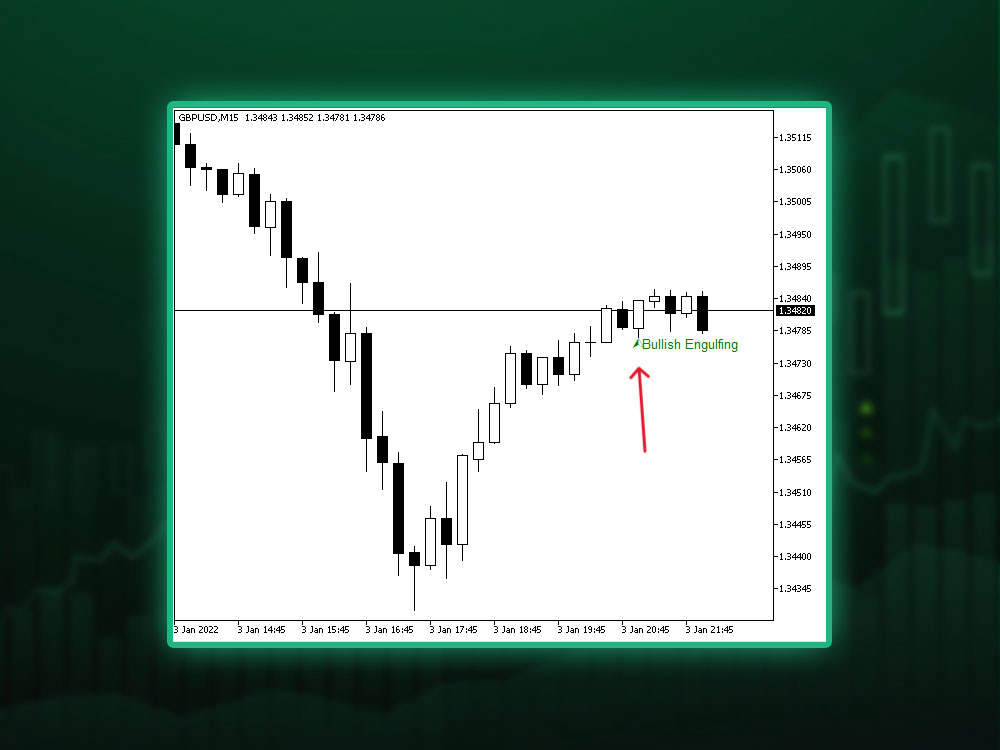
Bullish Engulfing Pattern
The bullish engulfing pattern is one of the clearest forex bullish candlestick patterns. It forms when a small bearish candle is followed by a large bullish candle that completely covers it. This shows a sharp shift from selling to buying pressure. The stronger and fuller the bullish candle, the more reliable the signal, especially after several red candles in a row.
4. Piercing Line
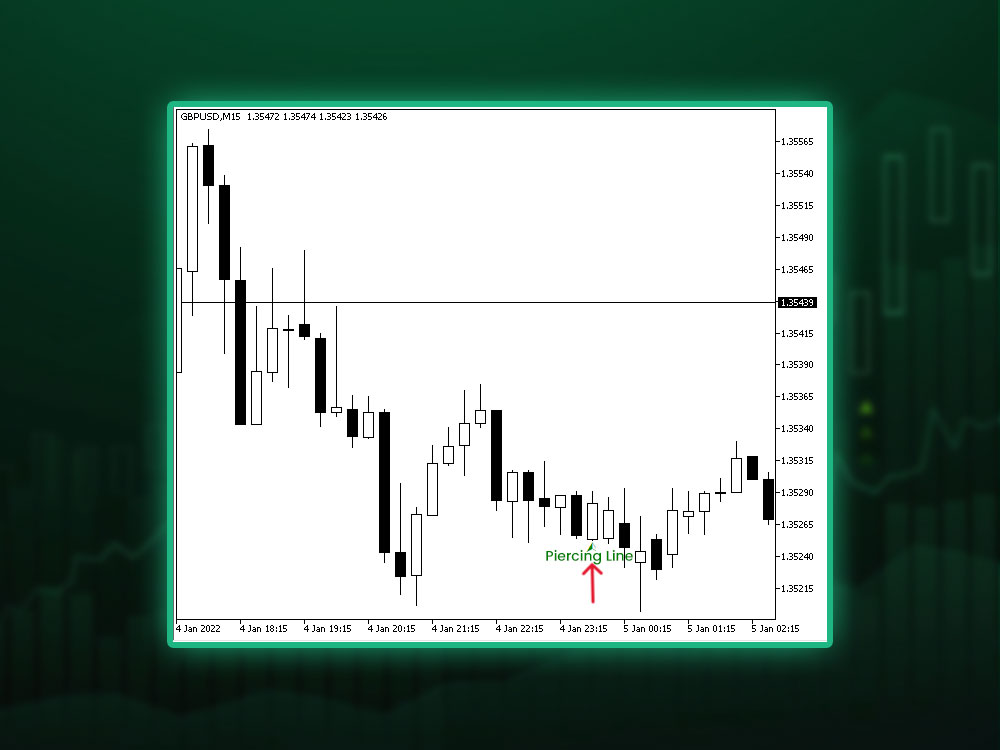
Piercing Line
This two-candle pattern starts with a bearish candle followed by a bullish one that opens below the prior low but closes above its midpoint. It shows that buying pressure has re-entered the market.
In forex, bullish candlestick charts like the piercing line work best after extended downtrends, particularly near psychological price levels or major support zones.
When using the Piercing Line setup, understanding proper risk placement helps protect gains and limit losses. Learn how to manage that balance in risk to reward ratio in forex.
5. Morning Star
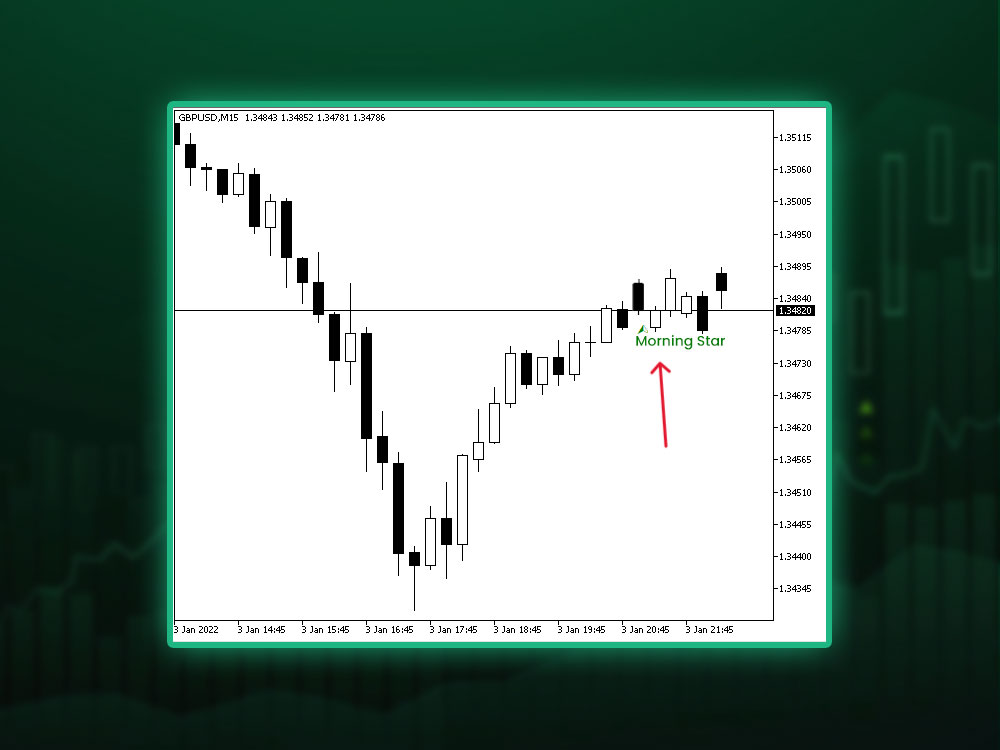
Morning Star
The morning star is a three-candle reversal formation. The first candle is large and bearish, the second is small (showing indecision), and the third is a strong bullish candle closing deep into the first one’s body.
Morning star candlestick pattern signals a shift from seller dominance to buyer strength. Confirmation comes when the third candle closes above the second’s high.
6. Three White Soldiers
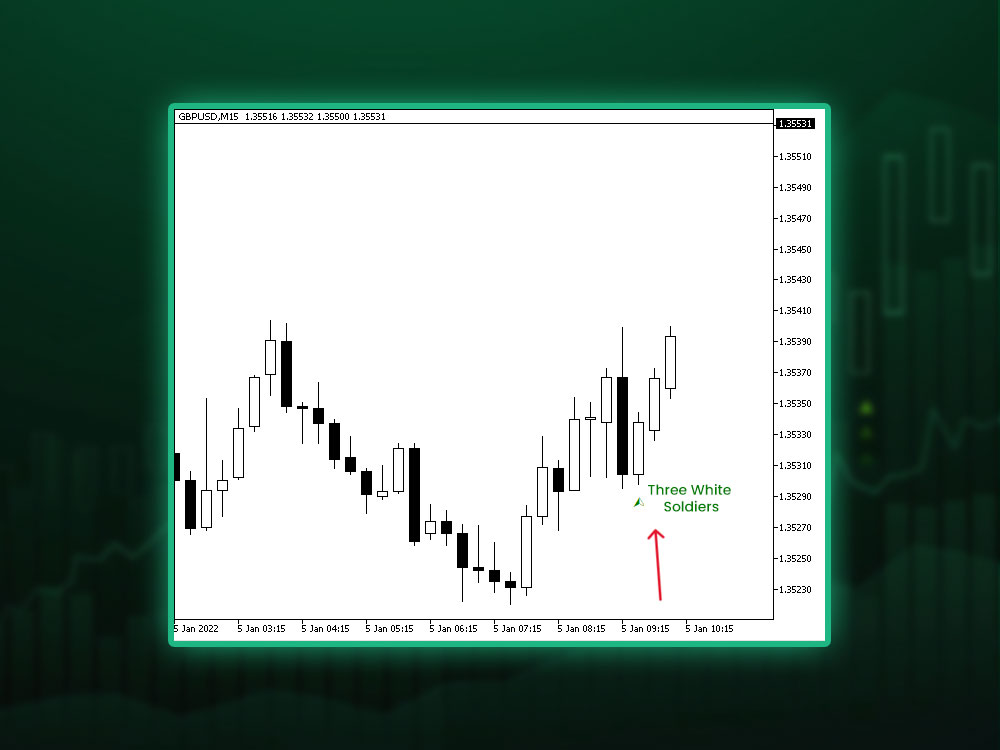
Three White Soldiers
The three white soldiers pattern consists of three consecutive long bullish candles, each opening within the previous candle’s body and closing higher. Shadows are small, showing strong momentum.
Among all forex bullish candlestick patterns, this one clearly demonstrates buyer confidence. It often signals the start of a solid uptrend after a long decline.
7. Bullish Harami
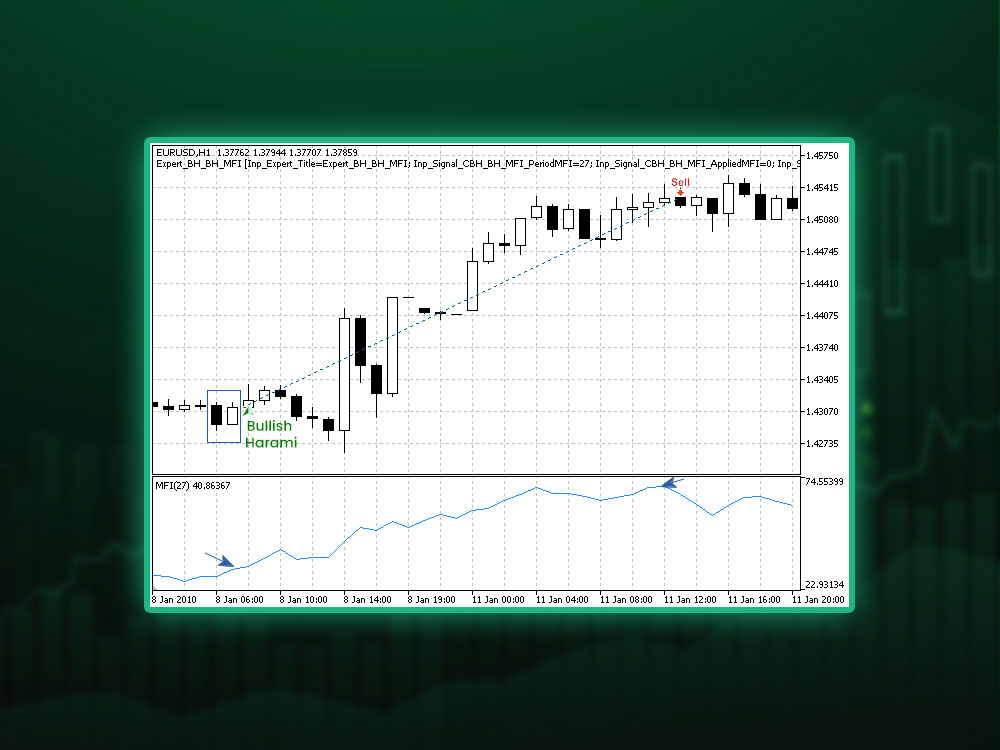
Bullish Harami
The bullish harami appears when a small bullish candle fits inside the previous bearish candle’s body. It indicates that selling pressure is slowing down. When the next candle closes higher than the harami’s high, it confirms reversal potential.
While not as strong as an engulfing pattern, the harami shows early signs that sellers are losing control. Please read this article about bullish harami candlestick patterns to learn more about it extensively.
8. Dragonfly Doji
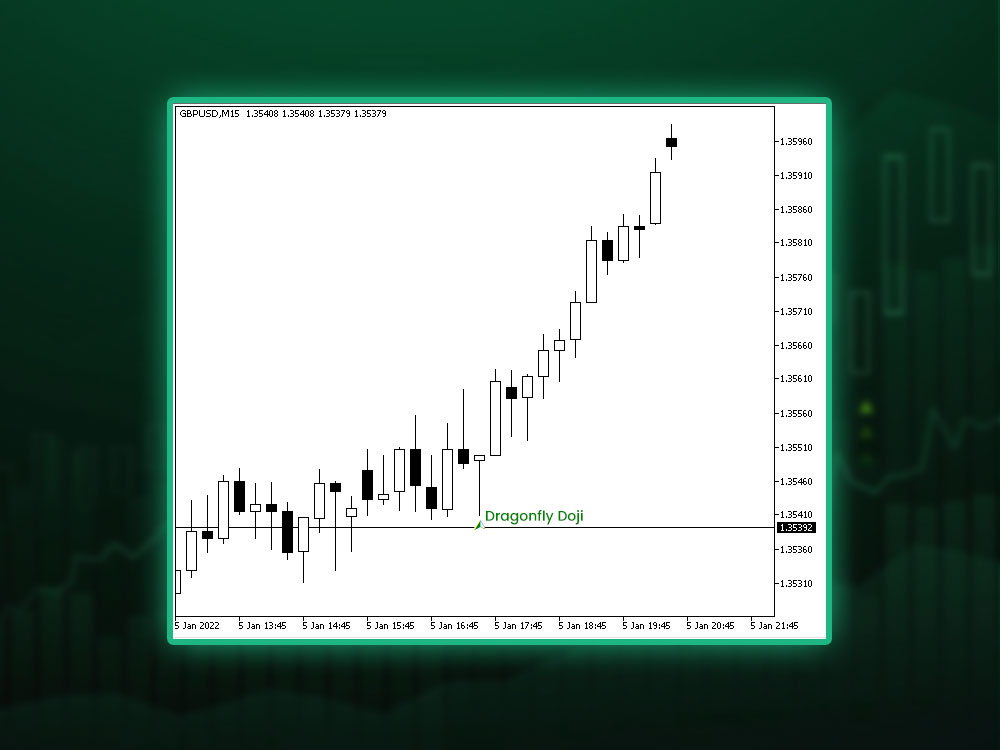
Dragonfly Doji
A dragonfly doji shows a long lower wick with almost no upper shadow. Sellers pushed prices down, but buyers pulled them back to the open. Doji candlestick signals rejection of lower prices and can point to a possible bullish move if followed by strong volume.
9. Bullish Belt Hold
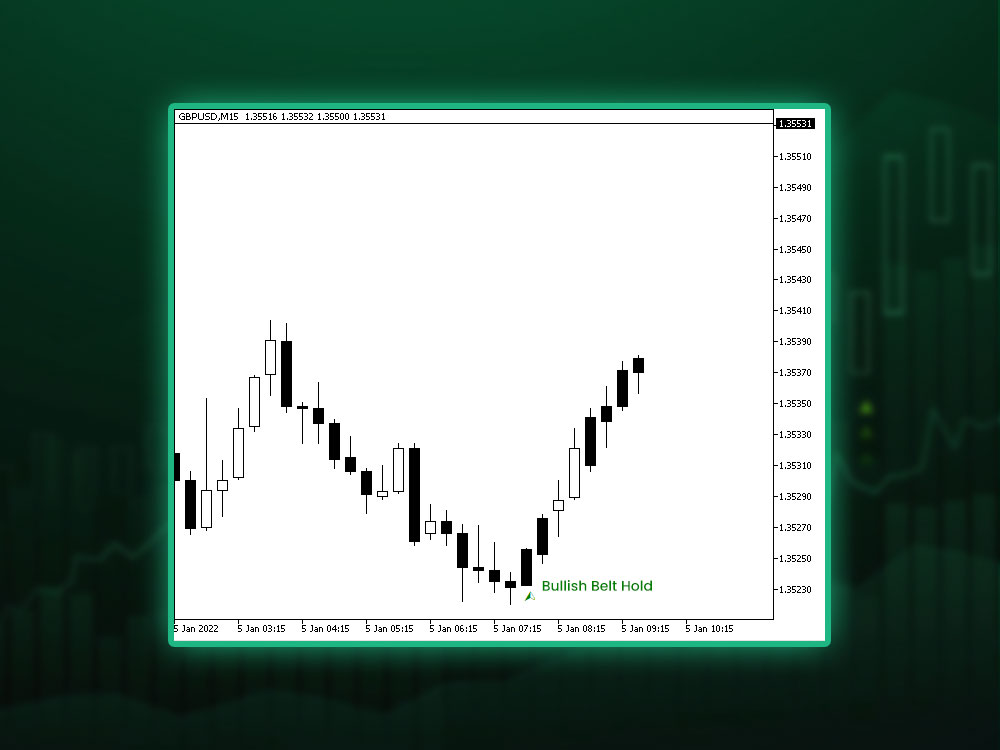
Bullish Belt Hold
The bullish belt hold candle opens near its low and closes near its high. It’s a long candle with minimal lower wick, showing strong buyer control from open to close.
After several bearish candles, it can signal the start of a short-term rally. Among practical bullish candlestick patterns forex traders use, this one is easy to spot.
10. Bullish Marubozu
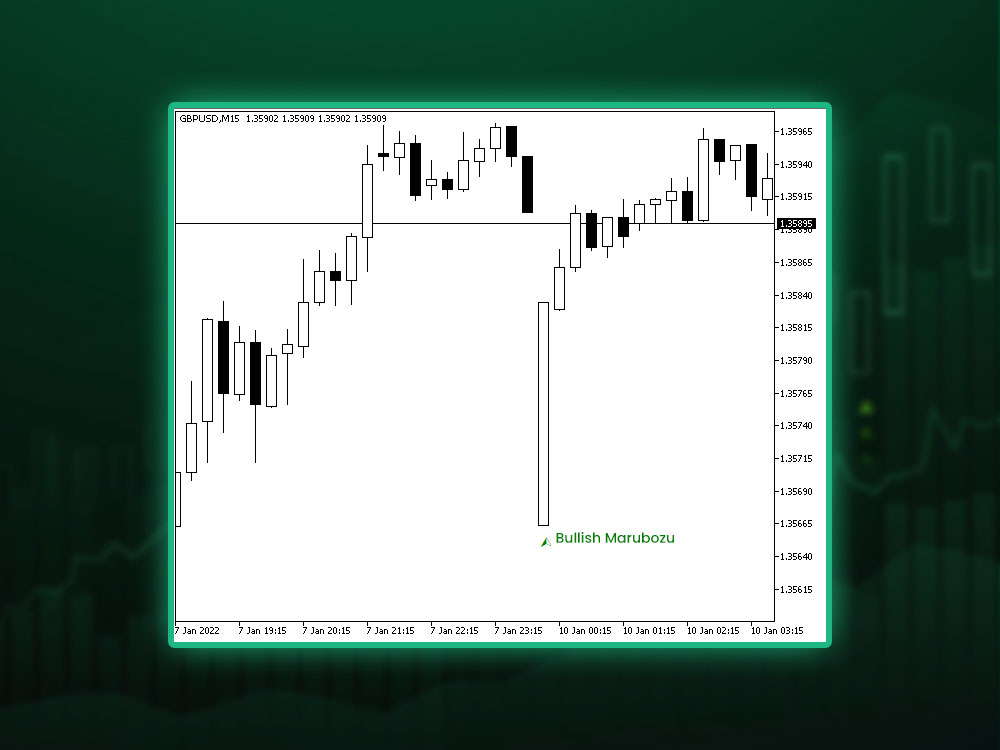
Bullish Marubozu
A bullish marubozu opens at the low and closes at the high with no shadows. It’s pure buying pressure from start to finish. When this candle appears after a downtrend, it shows conviction.
It can also confirm existing uptrend strength. Many traders view this as one of the most reliable continuation signals.
Once you can spot bullish signals with single-candle formations, expand into wider structures that show market pressure over more candles. Here’s a full breakdown of different forex chart patterns you can use alongside candlestick signals.
How to Confirm Forex Bullish Candlestick Patterns
Confirmation makes the difference between guessing and trading with confidence. Before acting on forex bullish candlestick patterns, use these checks:
- Trend check: Ensure a clear prior downtrend.
- Price level: Patterns near support or round numbers are more reliable.
- Next candle: Wait for it to close above the pattern’s high.
- Volume strength: Look for higher tick activity.
- Indicator support: Oversold RSI or MACD crossovers strengthen signals.
When multiple confirmations align, your trades have higher accuracy.
To improve how you read price action with indicators, support zones, and trend tools, explore our guide on forex technical analysis for a deeper breakdown of confirmation steps.
Common Mistakes When Trading Bullish Candlestick Patterns in Forex
Even seasoned traders misread bullish candlestick patterns forex signals. Here are key errors to avoid:
- Ignoring the bigger picture: A bullish signal in an ongoing uptrend may just continue the move rather than reverse it.
- Skipping confirmation: Entering without waiting for a follow-up candle often causes losses.
- Not using stop losses: Even strong setups can fail, so protect your position.
- Trading around news: Major announcements can make any pattern meaningless.
- Using very small charts: Stick to 1-hour, 4-hour, or daily charts for clearer signals.
Avoiding these mistakes keeps your trading steady and realistic.
Building a Simple Strategy with Forex Bullish Candlestick Charts
Here’s a simple way to build a practical plan using forex bullish candlestick patterns:
- Find the trend: Confirm that the market has been falling using a moving average or trendline.
- Look for the pattern: Spot a hammer, engulfing, or morning star that fits your setup.
- Wait for proof: Trade only after a bullish candle confirms the move.
- Enter the trade: Buy slightly above the pattern’s high.
- Protect yourself: Place a stop loss under the pattern’s low or a nearby support.
- Set your target: Aim for a reward at least twice the risk you take.
- Review your trades: Keep track of which patterns give the best results.
This steady method helps you stay objective and avoid emotional decisions.
If you want to build a full plan around entries, exits, and risk rules, explore these forex trading strategies that use candlestick patterns inside a structured system.
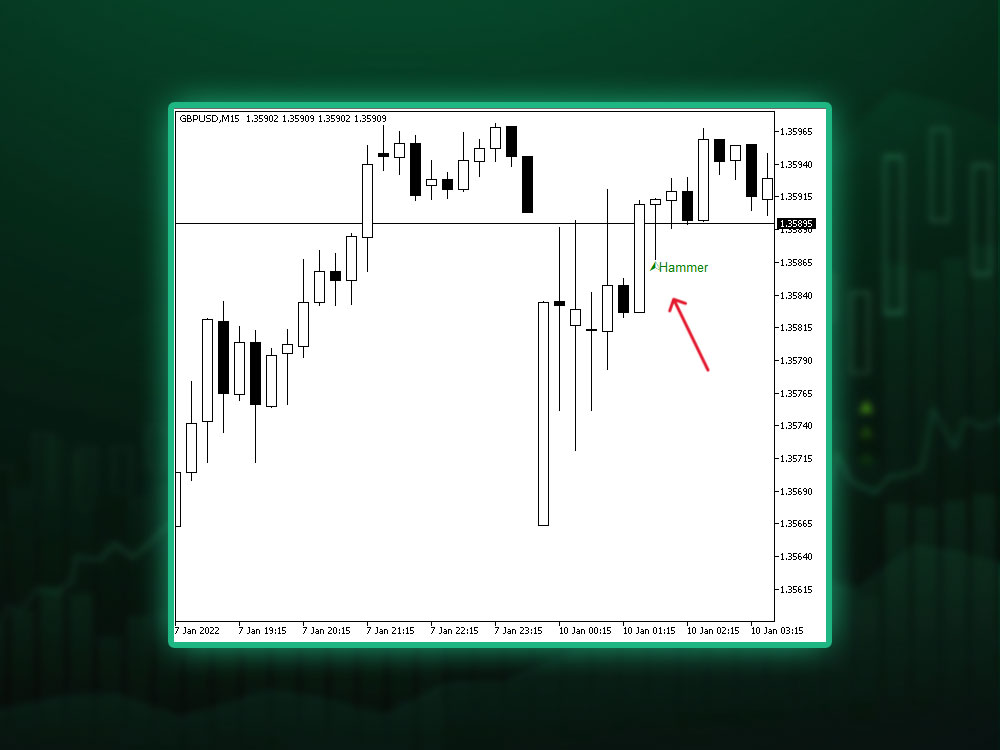
Example: Reading a Bullish Engulfing on GBP/USD
Reading a Bullish Engulfing on GBP/USD
Suppose GBP/USD has been falling for a week. Then, a small red candle forms followed by a large green one that completely covers it. That’s a bullish engulfing, one of the strongest forex bullish candlestick patterns.
If the next candle closes higher, that confirms buyers have control. A trader could go long above the engulfing candle’s high with a stop below its low. When combined with rising tick volume, this pattern often predicts sharp rebounds.
When to Avoid Bullish Candlestick Patterns in Forex Trades
Even the best signals fail under poor conditions. Avoid trading bullish candlestick patterns forex setups when:
- News events or economic reports are due.
- Markets move sideways with no clear trend.
- Volatility is unusually low.
- Higher-timeframe charts contradict your signal.
Waiting for clean setups pays off more than forcing trades.
Practice Makes Reading Accurate
It takes practice to master forex bullish candlestick patterns. Watch hundreds of charts. Study how patterns form, fail, and succeed. Use a demo account to test what you’ve learned before going live.
As you gain experience, you’ll begin to spot bullish candlestick patterns instantly and know which ones deserve your attention. Accuracy grows with repetition and patience.
Which Is the Best Bullish Candlestick Pattern in Forex?
Traders often ask, “Which is the best bullish candlestick pattern in forex?” The truth is, no single pattern works 100% of the time. However, some perform better in certain conditions:
- Bullish Engulfing: Reliable near strong support.
- Hammer: Great at identifying bottoms in volatile markets.
- Morning Star: Works well after prolonged selling pressure.
- Three White Soldiers: Strong sign of sustained reversal.
The “best” depends on market context, confirmation, and timeframe. Combine technical discipline with patience for best results.
Final Thoughts
Learning to read forex bullish candlestick patterns gives traders an edge. These formations reveal when fear is fading and confidence is returning. Still, context and confirmation matter, no pattern works in isolation.
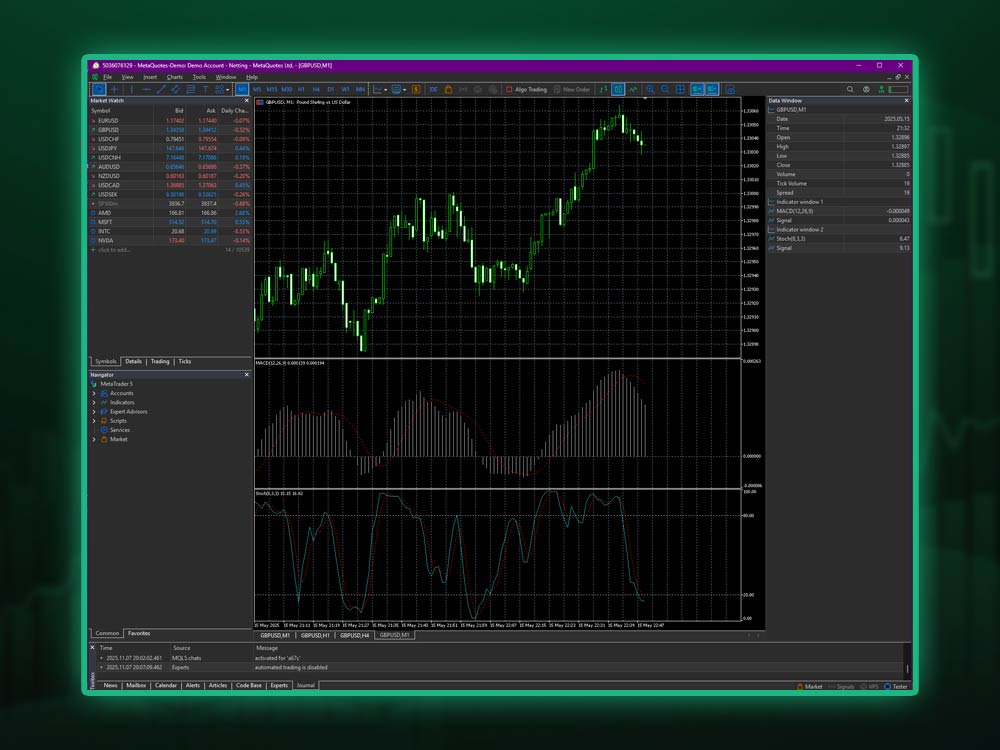
A practical way to sharpen your skill is by trading with a reliable forex broker like Dominion Options. Their fast execution, raw spreads, and transparent pricing make it easier to test bullish setups in real time. Dominion also offers advanced charting and access to platforms like cTrader and MetaTrader, giving traders clear visuals of every candle formation.
Use this guide as your starting point. Study live charts, review historical data, and test your strategies under real conditions. The more time you spend with bullish candlestick charts, the quicker you’ll recognize solid entries.
Each candle tells a story. Read it with patience and a clear mind. With practice, you’ll not only know which is the best bullish candlestick pattern in forex but also how to use it effectively,especially when paired with a reliable platform like Dominion Options.
FAQs: Bullish Candlestick Patterns Forex
1. What are forex bullish candlestick patterns?
They’re simple chart patterns that show when buyers begin pushing back after a selloff. They help traders see when momentum may be shifting and when prices might start climbing again
2. Which is the best bullish candlestick pattern in forex?
The bullish engulfing setup is a favorite among traders because it clearly shows buyers overpowering sellers. Still, no pattern guarantees results—context and follow-up confirmation matter most.
3. How can I trade bullish candlestick charts safely?
Wait for a confirming candle before entering. Keep stops just below the pattern’s low, and avoid trading during heavy news hours.
4. Can bullish candlestick patterns fail?
They can. Even solid signals sometimes break down in volatile or low-volume markets. Always protect yourself with stops.
5. What timeframe works best for reading bullish candlestick patterns?
Four-hour and daily charts often give cleaner, more trustworthy signals than short-term ones.
6. How often do bullish candlestick patterns appear in forex?
They appear regularly on most pairs, but only a few are worth trading. Stick to clean patterns forming near key support zones or round-number levels.