What is Supertrend Indicator and Why MT5 Traders Rely on It
Supertrend indicators are simple tools that help traders spot price trends and trade signals. They work on any market and timeframe. MT5 users trust them for fast, clear insights.
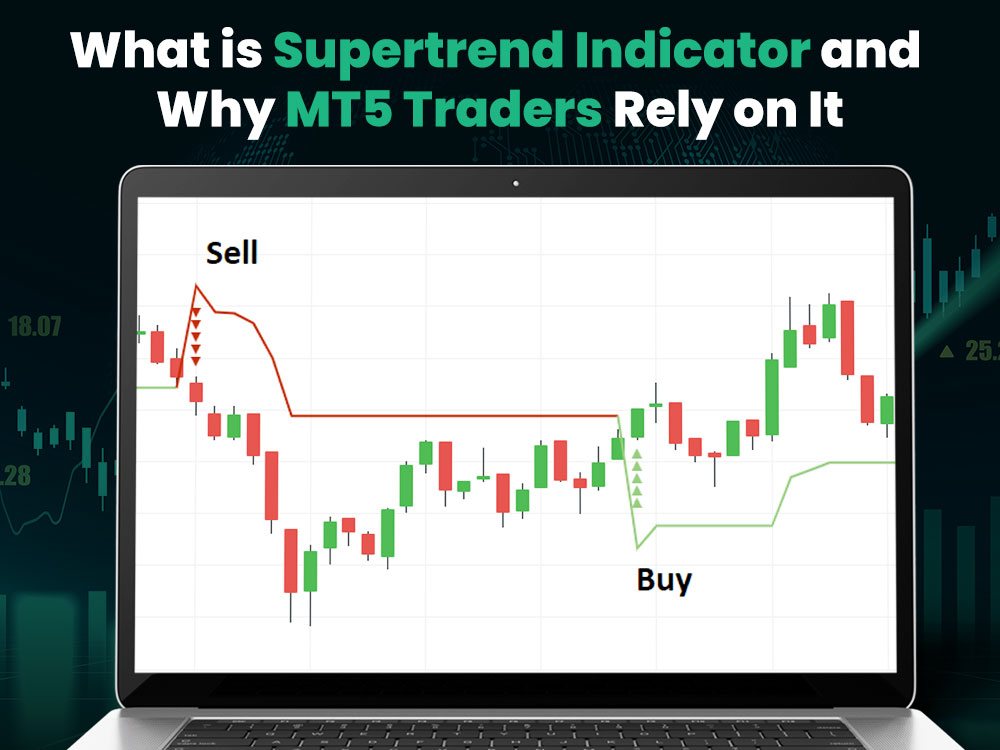
Each supertrend indicator uses a single line. This line changes color based on price movement. If it’s green, the trend is up. If it’s red, the trend is down.
You can use supertrend indicators for forex, stocks, crypto, and more. They suit day traders, swing traders, and even longer-term setups. If you're looking for a trading platform, Dominion Options is a solid choice. It offers tight spreads and high leverage, which work well with trend-based strategies like supertrend.
Let’s look at what makes them work and why MT5 traders keep using them.
What is Supertrend Indicator
What is Supertrend Indicator
Supertrend indicators rely on two tools:
- Average True Range (ATR), which measures price volatility
- A multiplier, which controls how close the line tracks price
Together, they create a line that reacts to trends. If price crosses the line, the color switches. That’s your trade signal:
- Green line = Buy signal
- Red line = Sell signal
This system is clean and easy to follow. You don’t have to study complicated charts or indicators. The line shows you exactly what’s happening. It updates in real time and changes color to match the trend. It keeps your screen simple, so you can focus on making decisions instead of overanalyzing data.
Supertrend vs Moving Average

Supertrend vs Moving Average
Some people confuse supertrend indicators with moving averages. They both follow price, but they behave differently.
Moving averages show the average price over a fixed number of bars. They smooth out the chart but react slowly to sudden moves. They also ignore volatility.
Supertrend indicators respond faster. They factor in price range and volatility using ATR. That makes them shift quicker when the market turns.
This speed helps in fast markets. If you’re day trading or scalping, early signals matter. You want to catch the trend early—not after it's halfway done.
For example, if EUR/USD is rising and crosses above the supertrend line, the line flips green. That’s your buy signal. If the price dips below it again, it flips red. That’s your sell signal. This happens faster than waiting for a moving average crossover.
Why MT5 Traders Like Supertrend Indicators
MT5 is a flexible platform. It offers many built-in tools. But many traders still choose to add supertrend indicators. Here’s why:
1. Easy to See
The supertrend line is color-coded. Green means the market is trending up. Red means it's trending down. You can look at the chart and know the trend instantly—no deep analysis needed.
2. Quick Signals
The line changes color as soon as price crosses it. That gives you fast buy or sell signals. You don’t need to wait for several candles to confirm. It helps you act early, especially in fast-moving markets.
3. Custom Settings
You can adjust how the indicator behaves. Lower the ATR period or multiplier for more signals. Raise them if you want fewer but more stable signals. These settings help match the tool to your style.
4. Works on All Charts
Supertrend indicators don’t depend on the asset. Use them on forex, stocks, crypto, indices—anything you can chart in MT5. The logic stays the same across all markets, making it a versatile tool no matter the instrument. If you're new to the platform, here's a quick overview of what is MT5.
5. No Guesswork
The color shift is the signal. You’re not reading complex indicators or trying to spot vague patterns. If it turns green, you think about buying. If it turns red, you look to sell or exit. That clarity saves time and avoids hesitation.
How to Add Supertrend Indicator in MT5

How to Add Supertrend Indicator in MT5
Adding supertrend indicators to MT5 is simple. It only takes a few clicks to get started.
- Open your MT5 platform.
- Go to the chart of the asset you want to trade.
- Click on 'Insert' in the top menu.
- Select 'Indicators' > 'Custom'.
- Choose 'Supertrend' from the list.
- Set your preferred ATR period and multiplier.
- Click OK. The indicator will appear on your chart.
To explore more tools like this, check out our article on other top MT5 indicators. It gives a full list of useful tools that work well alongside supertrend indicators.
How Does Supertrend Indicator Work
Here’s the math behind it. Each line uses these formulas:
- Upper Line = Median Price + (ATR × Multiplier)
- Lower Line = Median Price – (ATR × Multiplier)
Median Price = (High + Low) ÷ 2
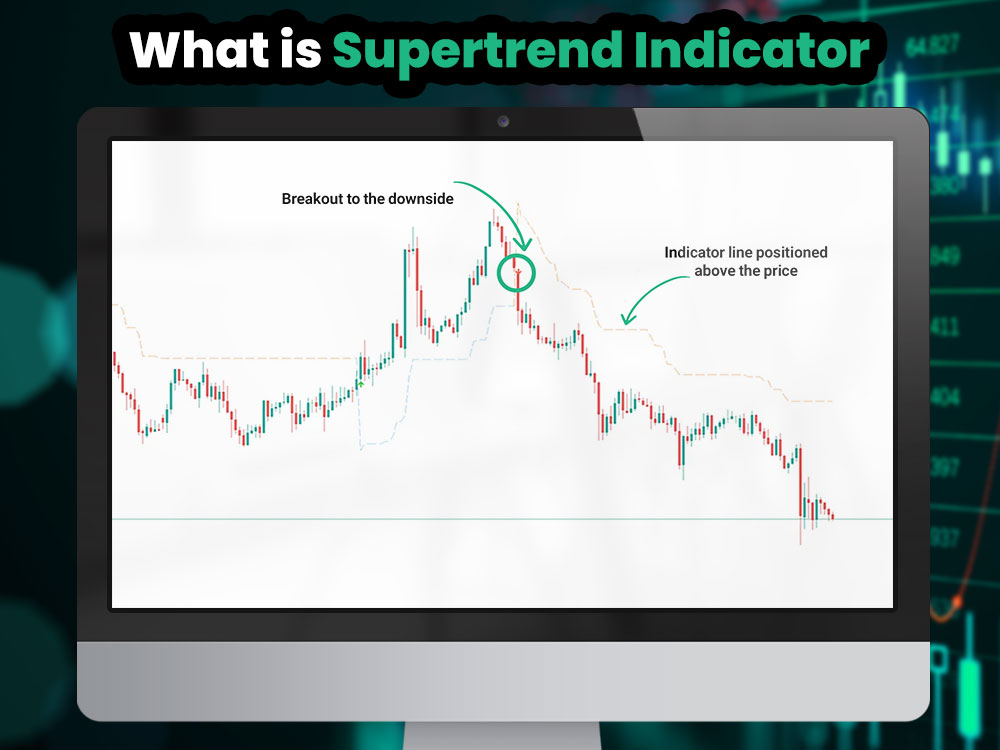
Only one of those lines appears at a time. If price is rising, the lower line shows. If price drops, the indicator flips to the upper line.
The line direction is locked:
- The lower line can’t go down
- The upper line can’t go up
This keeps the trend logic consistent. It avoids confusion by preventing the indicator from constantly shifting during small moves. That way, you only see a trend change when the market shows clear momentum in the opposite direction. This reduces noise and helps you stay focused on stronger signals.
For more insight into technical tools, check out our article on the best forex indicators. It highlights top picks that can work with supertrend to improve your strategy.
Supertrend Example in Trading Currency Pairs

Supertrend Example in Trading Currency Pairs
Imagine EUR/USD is trending up. It's trading at 1.0850. The high is 1.0900 and the low is 1.0800. The median price is 1.0850.
The ATR is 0.0020, and the multiplier is 3.
Lower Supertrend = 1.0850 – (0.0020 × 3) = 1.0790
EUR/USD is above 1.0790. The trend is up. The line is green.
Now price drops to 1.0730. Median is 1.0750.
Lower Supertrend = 1.0750 – (0.0020 × 3) = 1.0690
But the lower line can't fall, so it stays at 1.0790. Since price is now below it, the line flips red.
Upper Supertrend = 1.0750 + (0.0020 × 3) = 1.0810
The trend is now down.
If you're trading pairs like EUR/USD or GBP/JPY and want to act fast on these trend signals, a reliable platform matters. Dominion Options offers tight spreads, high leverage, and fast execution—ideal for technical traders who use trend-based tools. It also supports other useful chart tools like support and resistance indicators, helping traders refine entries and exits around key levels.
How to Use Supertrend Indicators
Fibonacci Retracement
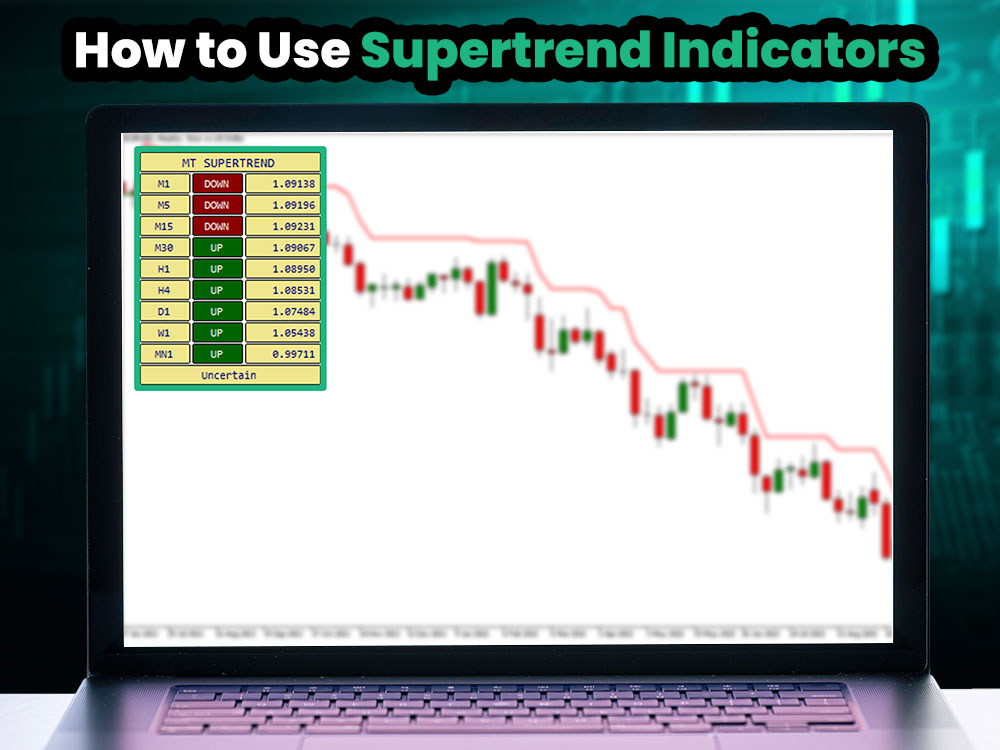
Here’s a basic step-by-step guide:
- Add supertrend indicators to your MT5 chart
- Wait for a color change
- Green = buy
- Red = sell
- Add RSI, Stochastic, or ADX to confirm the move
- Place a stop-loss to control risk
- Exit when the trend flips again
You can use this approach on any timeframe. For quick trades, use 1-minute to 15-minute charts. For swing trades, go with 1-hour to daily.
Best Settings for Supertrend Indicators
Default settings:
- ATR Period: 10
- Multiplier: 3
These work well in most markets.
Want more signals? Lower the values.
Want fewer, stronger signals? Raise them.
Try different settings and see what works with your strategy.
Should You Use Supertrend Indicators Alone?
Not really. supertrend indicators are great in trending markets. But they struggle when price moves sideways.
You’ll get false signals in a choppy chart.
That’s why traders often pair them with other tools, like:
Even adding one of these helps filter out bad signals.
Are Supertrend Indicators Reliable?
Yes, in trending markets. They give clear entry and exit points. You won't catch every top or bottom, but you’ll ride the bulk of a move.
In sideways markets, they’re less useful. That’s where confirmation tools come in.
Many traders use supertrend indicators as their base signal. Everything else helps them decide whether to act.
Why Beginners Like Them
- Easy to understand
- No guesswork
- Instant signals
- Built-in alerts
- Minimal setup
Even if you’re new to MT5, supertrend indicators help you learn fast. However, it’s still useful to understand the basics—start here: how to use MT5.
Final Thoughts
Supertrend indicators are trusted by MT5 traders for a reason. They’re simple, smart, and flexible.
They don’t do everything. But they do one thing very well: spot trends.
Use them right — with other tools and risk controls — and they can improve your trades.
If you’re trading with MT5 and want clean, fast signals, add supertrend indicators to your chart. You’ll see the trend. And that’s the first step to staying on the right side of it.
Dominion Options is a strong choice if you're serious about trading with the supertrend indicator. It offers tight spreads, fast execution, and high leverage—giving you the speed and cost-efficiency needed for short-term trend strategies. Whether you're trading forex majors or minor pairs, it's built to support technical traders who rely on precise, real-time decisions.
Frequently Asked Questions
What is the accuracy of supertrend indicator?
The supertrend indicator is accurate when markets are trending clearly. It tracks direction and reacts fast to momentum shifts. But it doesn't perform well in sideways markets. In those cases, price crosses the line often, creating false signals. Traders reduce this risk by using confirmation tools like RSI or ADX.
How to calculate supertrend indicator
To calculate the supertrend indicator, follow these steps:
- Find the median price: (high + low) ÷ 2
- Calculate the Average True Range (ATR) over a chosen period (e.g., 10 bars)
- Choose a multiplier (common value is 3)
- Use these formulas:
- Upper line = median price + (ATR × multiplier)
- Lower line = median price – (ATR × multiplier)
The indicator displays one of these lines based on price action. If price is above the lower line, it shows the uptrend. If price falls below, it switches to the upper line to show a downtrend.
How to Interpret Supertrend Indicator
Reading the supertrend indicator is simple. The line on the chart changes color with the trend. When the line is green and price stays above it, the trend is likely up. If the line turns red and price falls below it, the trend is likely down.
A switch from red to green can mean a good time to buy. A switch from green to red can suggest selling or exiting a position. Use this as a visual cue to act, but always confirm with other indicators.
Avoid trading based only on color changes during flat or sideways markets. The indicator can flip often and mislead. It's best used when price is moving clearly in one direction.