
Top 5 Trading Strategies for Beginners on Dominion Options
Before starting your journey on Dominion Options, you must find the right strategy to use for trading. This article will focus on the top 5 trading strategies that will give you a competitive edge and help you along your trading journey.
Retracement Trading
A retracement is a short pullback during a trend. Therefore, if the price is bullish, the brief dips are retracements. Meanwhile, if the price is on a bearish trend, the short rises are retracements. The best tool for showing these levels is the Fibonacci retracement tool. You can also use moving averages to catch retracements.
Retracement trading
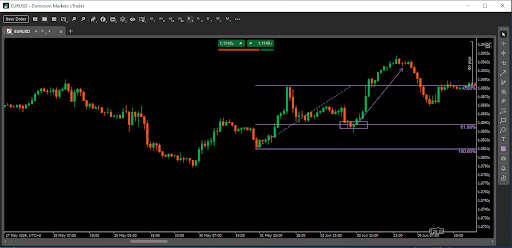
The Fibonacci tool draws levels where the price might retrace and find support and resistance. In the above chart, the price is on a bullish trend. However, it keeps pulling back, making higher lows. Every time the price pulls back, traders can enter the uptrend with a buy position.
Above, the price pulled back to the 0.618 Fib level, where price action showed a looming reversal to the upside. Here, you can place a buy entry and take advantage of a new bullish swing. Place your stop loss below the Fib level with appropriate targets.
MA retracement trading
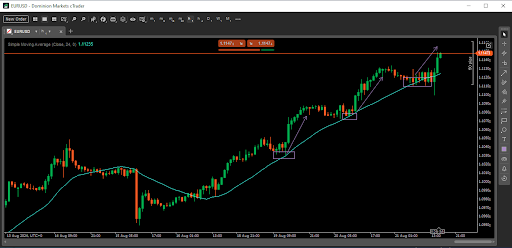
At the same time, you can use moving averages to catch retracement. The 24 SMA shows a bullish trend in the 1-hour chart in the above image. However, after every new swing, the move keeps returning to the SMA, creating great buy opportunities. When the price reaches the SMA, place a buy entry with your stops slightly below the SMA line. Place your targets depending on your risk-reward ratio.
MA Crossovers
MA crossover
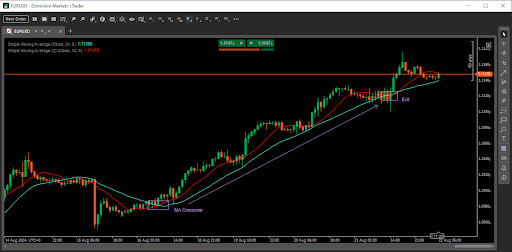
The Moving Average Crossover strategy shows the best entry and exit points to catch trends. To use this strategy, decide on a fast and a slow moving average to show the price trend. In the image above, we are working with a fast 12 SMA and a slower 24 SMA. The fast SMA shows the steeper trend, while the slow one shows the bigger, shallower trend.
When the fast SMA crosses above the slow SMA, it indicates the start of a bullish trend. Therefore, it creates a good buy signal. On the other hand, when the fast SMA crosses below the slow SMA, it indicates the start of a bearish trend. Therefore, it creates a good sell signal.
In our sample above, the 12 SMA crossed above the 24 SMA at the bottom of the chart, creating a buy signal. This is the best place to enter along with stops below the previous low. Hold the position until the 12 SMA crosses below the 24 SMA to show the opposite signal.
The MA crossover strategy works well to identify significant trends. However, in a ranging market, it creates many false signals. Therefore, consider changing the strategy when the market starts ranging or staying on the sidelines.
The type of moving averages you pick will depend on the kind of trend you want to catch. Using the crossovers of a 200 SMA and a 100 SMA will catch shallower and longer-term trends. On the other hand, using the 12 SMA and 24 SMA will catch steeper trends.
SRC/Market Fluidity University
Raja Banks, the founder of Dominion Options, focuses on trading price action. His strategy combines volume and price action to take advantage of impulsive market moves. To catch the best volumes, you must focus on the time/session you are trading.
Just before a big session opens, the market volume and volatility increase, creating opportunities to catch great entries. For instance, you can wait to catch trades before the London session opens.
Another major part of this strategy is studying candles and price action. Raja’s strategy focuses on identifying key levels and breakouts based on candlesticks. This involves studying candle opens, closes, highs, and lows. He also emphasizes studying wicks to know when to enter the market.
Raja’s Price Action strategy
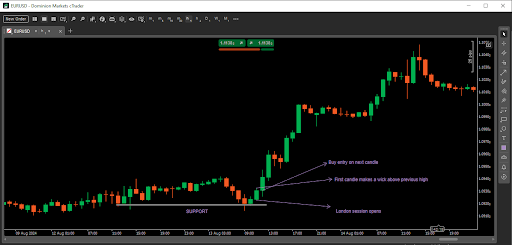
The chart above better explains price action. Looking at the candles, you can see the volume is low, and the price moves in a shallow bullish trend. The price returns to a support level just before the London session opens. It forms a lower wick at the support but fails to continue lower. The next candle is bullish but does not break above the previous high. When the London session opens, the price forms another bullish candle that breaks above the previous high and forms a wick. Place your buy entry on the next candle with appropriate stop losses.
You can see more of Raja’s Price Action strategies on his YouTube channel. These strategies will give you a competitive advantage in the market.
Breakout Strategy
Another popular trading strategy is the breakout strategy. Here, traders look for breakouts above or below critical levels before entering trades. Therefore, the first step to this strategy is identifying support and resistance areas. Once you have found such a level, wait for the price to break below or above and place your entries.
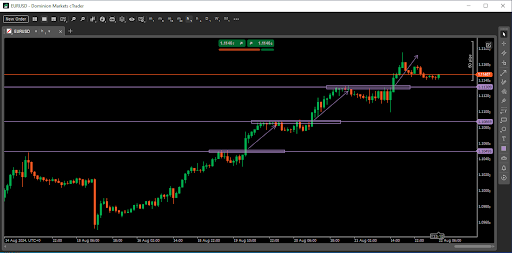
Breakout trading
In the same EUR/USD chart from the first strategy, we see a different way of participating in the bullish trend. Every time the price makes a swing high, it pauses at a strong resistance level before pulling back, creating a good breakout opportunity. The pause indicates that bulls are exhausted or taking a break to lock in some profits.
When bulls regain momentum, the price rises to retest the resistance level. It can either break above to continue the bullish trend or bounce lower. To catch the best breakouts, wait for the price to push above, with a strong candle indicating a surge in momentum. Place your entry on the next candle with a stop loss below the recently broken resistance. You can choose to hold the trade until the trend reverses. To do this, you can add a moving average to follow the trend. On the other hand, you can trade the swings, exiting when bulls weaken and entering new trades when the price makes new breakouts.
News Trading
Trading the news is another big strategy for beginners. Instead of plotting patterns on charts trying to predict the direction of the price, you can just wait to trade big news releases. In the forex market, some economic reports significantly impact prices. They cause a lot of volatility and create good trading opportunities. These reports include inflation, employment, retail sales, GDP, and central bank policy meetings.
When a country releases an economic report, the difference between the forecast and the actual figure causes a significant market move.
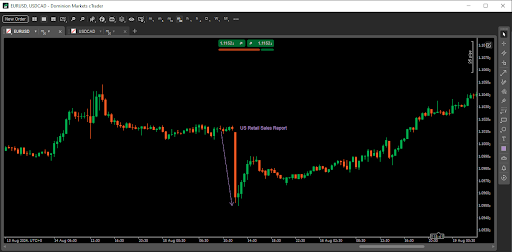
News trading
Last week, on August 15th, the US released its retail sales report. The forecast was 0.4%, while the actual figure was much higher at 1.0%. As a result, the US dollar strengthened, pushing EUR/USD lower. There are two ways to trade this. Knowing the dollar would strengthen, you could have sold right after the report.
On the other hand, you could have placed limit orders before the news, above and below the price. In this case, there is no directional bias. The focus is on the increased volatility after an economic report.
There are many great strategies for beginners. However, we have focused on the top 5 above. Join Dominion Options today and use some of these top 5 strategies to participate in the forex market.