Forex Chart Patterns That Show Real Strength or Weakness
Forex moves in repeatable shapes. These shapes are called forex chart patterns, and they show when buyers or sellers have real power. When you learn to spot these forex trading chart patterns, you start to see strength, weakness, and the shift between the two. The goal is not to guess. The goal is to read what price is showing on the trading graph.
This guide breaks down the classic chart patterns that matter. You will learn what they mean, how they form, and how traders use them to find good setups.
The patterns covered here work because they reflect the behavior of real buyers and sellers. They appear on all forex trading charts, on all timeframes, and in all market cycles. If you want a clean place to practice these setups with raw spreads and quick execution, joining Dominion Options can help you test them in real conditions without stress.
Why Forex Chart Patterns Help You Read the Market
Price does not move in a straight line. It moves in waves that build shapes. These shapes show:
- When a trend is gaining strength
- When a trend is fading
- When a breakout has power
- When a break is weak and should be avoided
- When a new trend is ready to start
These shapes, or trade patterns, work because traders react in similar ways at key levels. When you learn to spot these reactions, you can understand the story behind the candles.
Patterns only matter when they break cleanly. A pattern is not complete until price closes outside the shape. That is when strength or weakness becomes clear.
Here is a List of Forex Chart Patterns Every Beginner Trader Should know
Here is a simple list of patterns you will see often. Each one shows clear strength or weakness when it forms clean and breaks with force.
1. Ascending Triangle: Clear Buying Strength
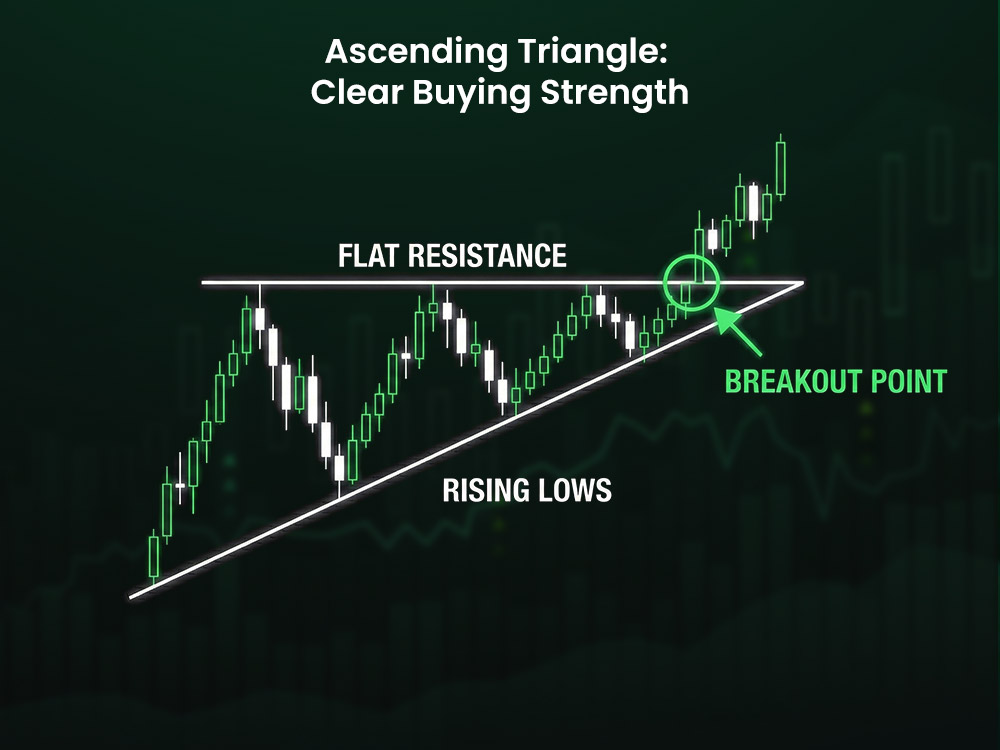
Ascending Triangle: Clear Buying Strength
The ascending triangle is one of the most successful chart patterns for spotting rising strength. It forms when price hits the same resistance many times while the lows keep rising. This squeeze shows growing pressure from buyers.
Ascending Triangle signs:
- Flat top level
- Rising bottom level
- Higher lows each time
- Tight structure on the trading graph
Why it shows strength: Buyers come in sooner with each dip. Sellers defend the top, but they lose power with each test.
Strong breakout signs:
- Big breakout candle
- Close above resistance
- Smooth follow-through
Weak breakouts drift above the top with no real force.
This is one of the forex chart patterns that signals strong continuation. You can also learn more through the bullish candlestick patterns guide because buyers have been taking control with each higher low
Example of Ascending Triangle in Action
For example, if XAU/USD keeps pressing into a clear resistance like 2360 while making higher lows, the ascending triangle builds pressure. When price finally breaks above 2360 with a clean bullish candle, buyers often push the move higher in a smooth run because the buildup shows strong demand waiting to break through.
2. Descending Triangle: Clear Selling Strength
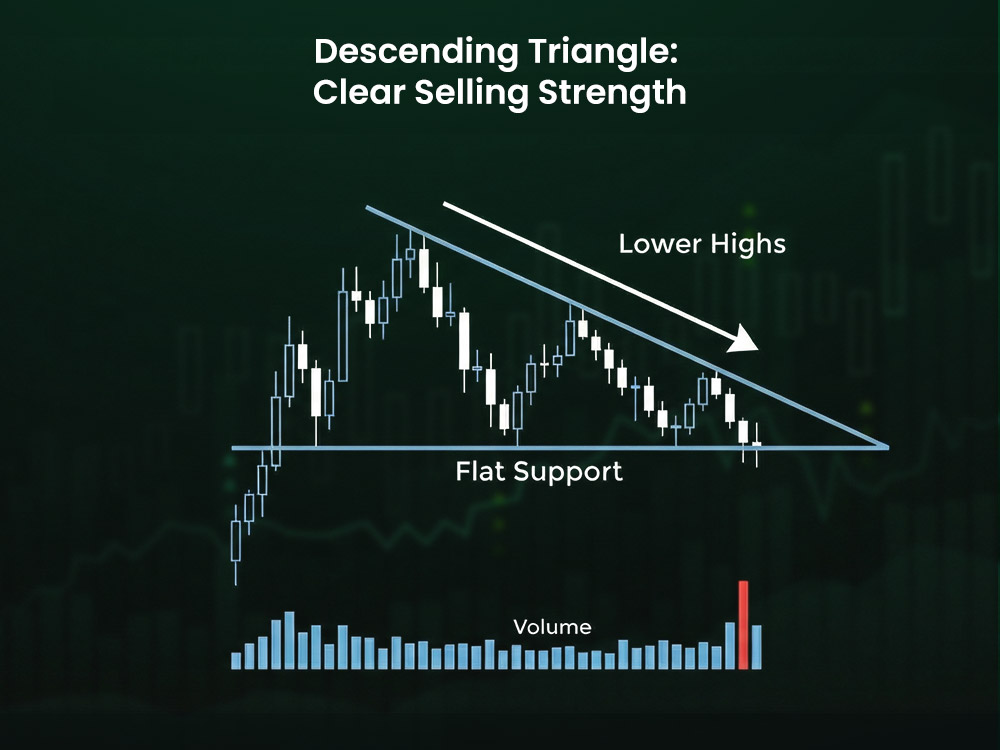
Descending Triangle: Clear Selling Strength
The descending triangle is the mirror opposite. It is the pattern that shows real weakness in a trend. The top moves down while the bottom stays flat.
Descending Triangle Pattern signs:
- Flat support
- Lower highs
- Tight squeeze
- Controlled pressure from sellers
Why it shows weakness: Buyers try to hold a level, but sellers keep pushing them back.
Strong breakdown signs:
- Sharp break under support
- Clean close
- Fast drop that holds
This is one of the trade patterns that confirms selling control. A deeper look at how structure shifts can be found in the resistance and support indicator guide.
3. Symmetrical Triangle: Strength Appears on Breakout
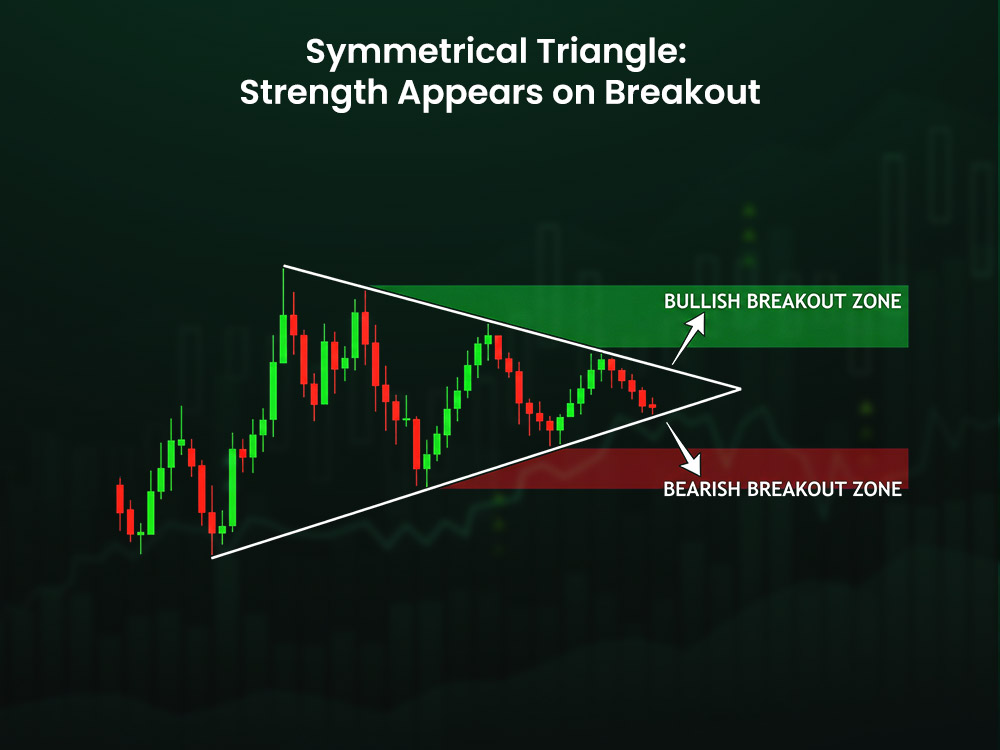
Symmetrical Triangle: Strength Appears on Breakout
A symmetrical triangle is a neutral shape during the build-up. It forms when both sides squeeze price from above and below.
Symmetrical Triangle Pattern signs:
- Lower highs
- Higher lows
- Tight coil
- Clear shape on the forex trading charts
During the formation, you do not know who will win. The force comes from the breakout.
Strong breakout signs:
- Break near the end of the squeeze
- Big candle
- Follow-through after the break
This is also one of the most common forex trading chart patterns during news weeks. To improve timing during these setups, check the perfect entry and exit guide. It shows pressure building in both directions.
Example of Symmetrical Triangle
For example, if USD/AUD moves into a tight squeeze before major news, with lower highs and higher lows forming a clean triangle, traders wait for the break. If price breaks above the top of the triangle with a strong candle, buyers often push a clear move upward because the buildup creates stored energy.
4. Bull Flag: Strong Trend With Short Pause
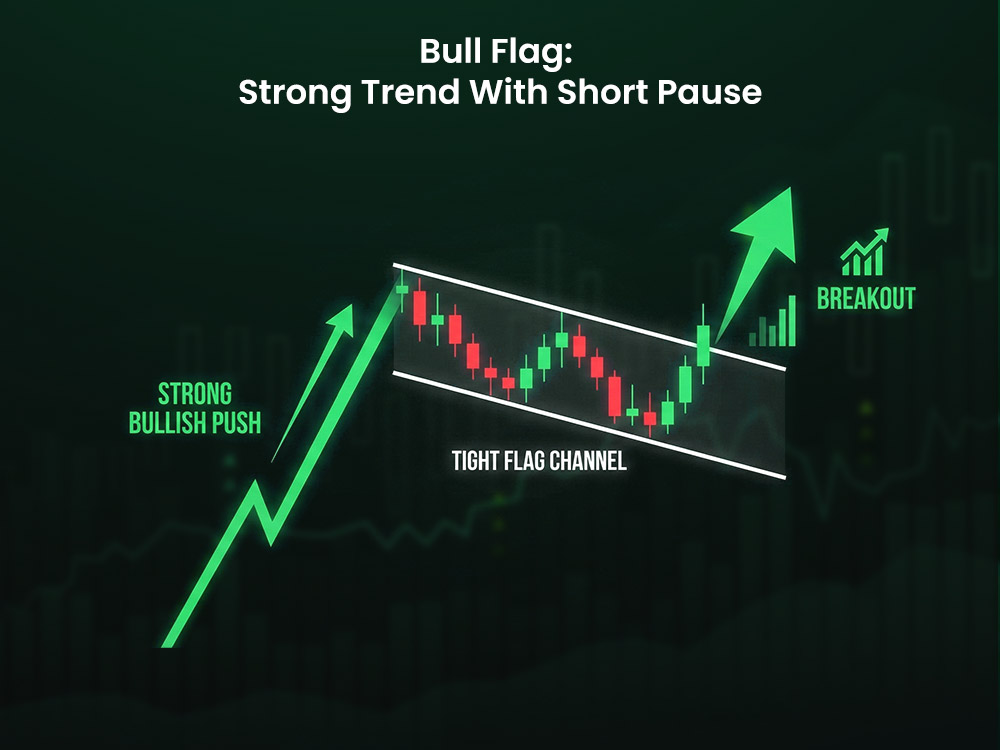
Bull Flag: Strong Trend With Short Pause
The bull flag is a pattern that shows solid strength after a fast move. The move shoots up, pauses, then shoots again.
Bull Flag Pattern signs:
- Sharp impulse
- Slow pullback
- Tight range
- Breakout with speed
A clean bull flag on any trading graph shows strong trend energy. You can also study how momentum builds using the forex intraday trading strategy because it confirms buyers are still in full control.
Bull Flag Example
A clean bull flag on any trading graph shows strong trend energy because it confirms buyers are still in full control. For example, if USD/JPY pushes up from 149.00 to 150.20 in a strong move, then pulls back slowly to 149.80 inside a tight channel, the bull flag is forming. When price breaks above the flag with a clear bullish candle, buyers often drive the move higher toward the next zone without much resistance.
5. Bear Flag: Strong Trend Down With Light Pullback
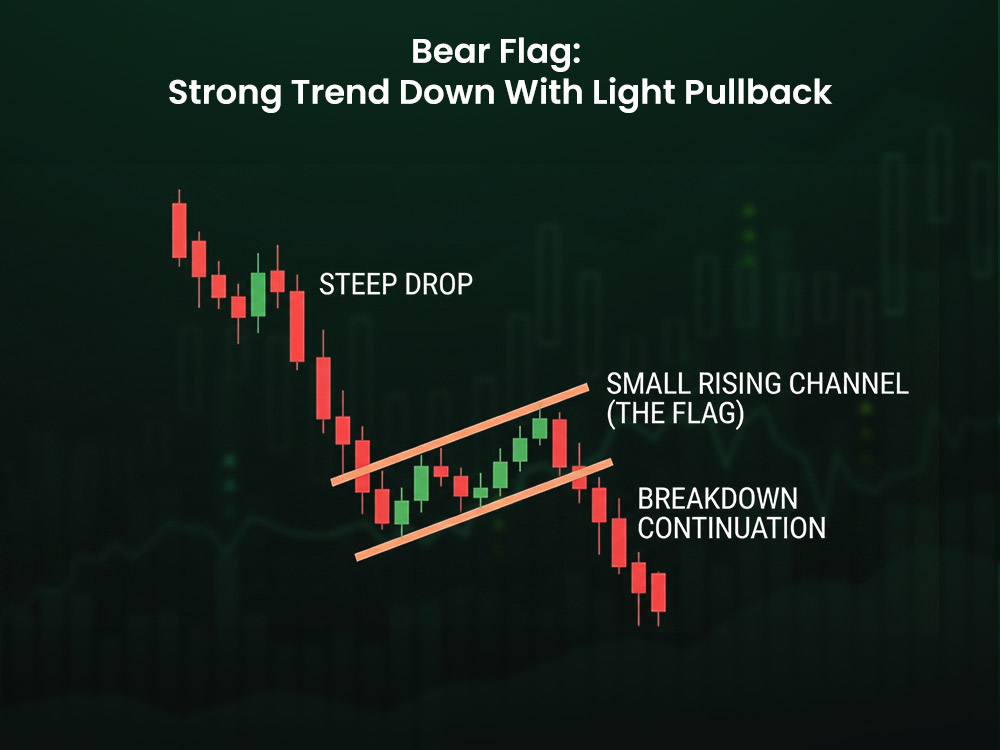
Bear Flag: Strong Trend Down With Light Pullback
A bear flag works the same way but in a downtrend. After a strong drop, price pulls back in a small channel.
Bear Flag pattern sign
- Sharp drop
- Weak bounce
- Tight channel
- Fast breakdown
Weak sellers create messy channels. Strong sellers keep the pullback clean.
This is a simple but powerful forex chart pattern used by many day traders. For more pattern-based setups, explore the engulfing and doji pattern guide because it shows when a pullback is weak and sellers have no control.
Bear Flag Example
For example, if XAU/USD drops hard from 2330 down to 2310, then pulls back slowly toward 2318 inside a small channel, the bear flag is forming. Once price breaks below the channel with a clean red candle, sellers often push the move down toward the next zone without much resistance.
6. Rising Wedge: Weakness in an Uptrend
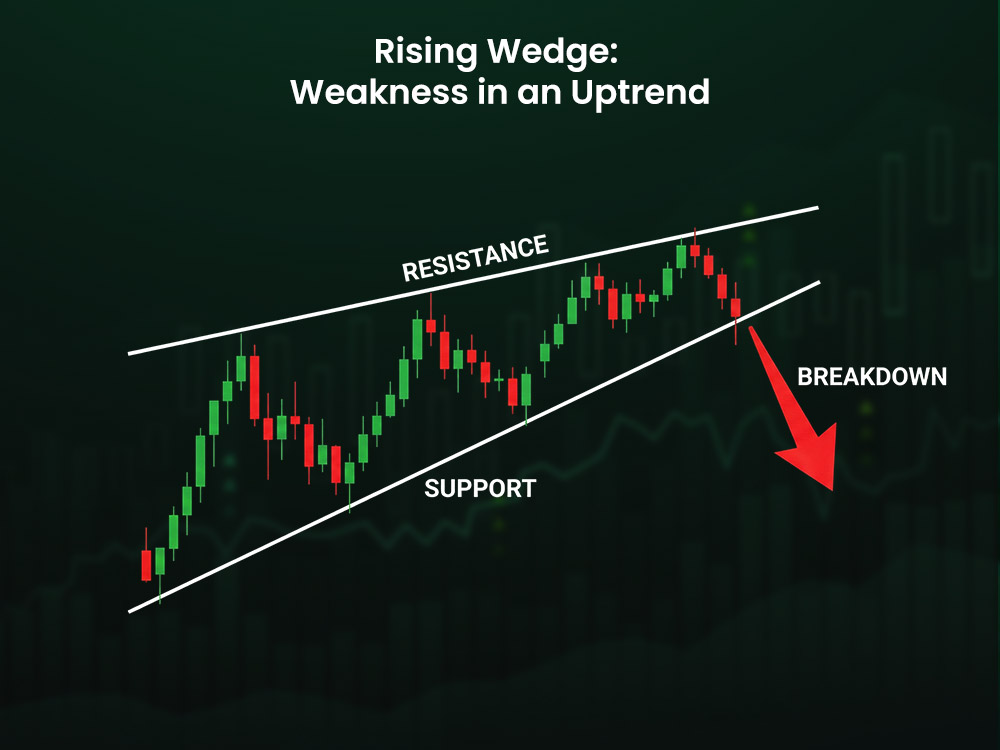
Rising Wedge: Weakness in an Uptrend
A rising wedge looks like a trend going up, but the inside movement shows fading buyer power.
Rising Wedge Pattern signs:
- Higher highs
- Higher lows
- Narrow swings
- Both trend lines rising
This is one of the chart patterns that warns you early about a shift. It shows the trend is slowing.
Strong weakness signs:
- Hard break below the lower trend line
- Big red candle
- No fast recovery
A rising wedge near resistance is a warning sign on all forex trading charts. This type of shift is similar to what you’ll see in the harami candlestick pattern guide because it shows buyers running out of force right at a level where sellers expect to step in.
Rising Wedge Example
For example, if XAU/USD climbs toward a strong zone like 2350 while forming a rising wedge, then breaks the lower trend line with a clean red candle, sellers often take over fast and push price down in a smooth move.
7. Falling Wedge: Building Strength in a Downtrend
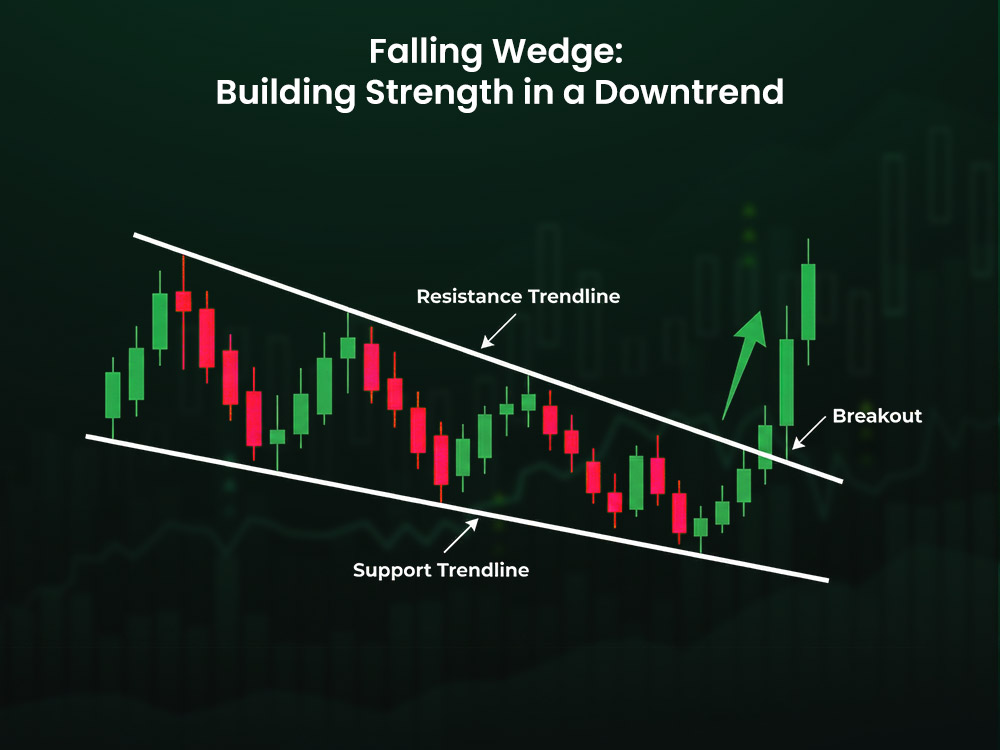
Falling Wedge: Building Strength in a Downtrend
A falling wedge shows sellers losing control. Price moves down, but the moves slow down with each swing.
Falling Wedge Pattern signs:
- Lower highs
- Lower lows
- Shrinking range
- Both trend lines falling
When buyers break out of the wedge, strength appears at once.
Strong breakout signs:
- Clean close above the wedge
- A wide candle
- No fade after the break
This is one of the trading patterns that often leads to sharp reversals. You can compare this to the moves seen in the morning and evening star guide.
Falling Wedge Example
For example, if XAU/USD keeps making lower highs and lower lows inside a tight falling wedge near a key zone like 2300, then breaks above the wedge with a strong bullish candle, buyers usually push a clean move upward. This happens because sellers lose control as each swing weakens, and the breakout confirms buyers stepped in with real intent.
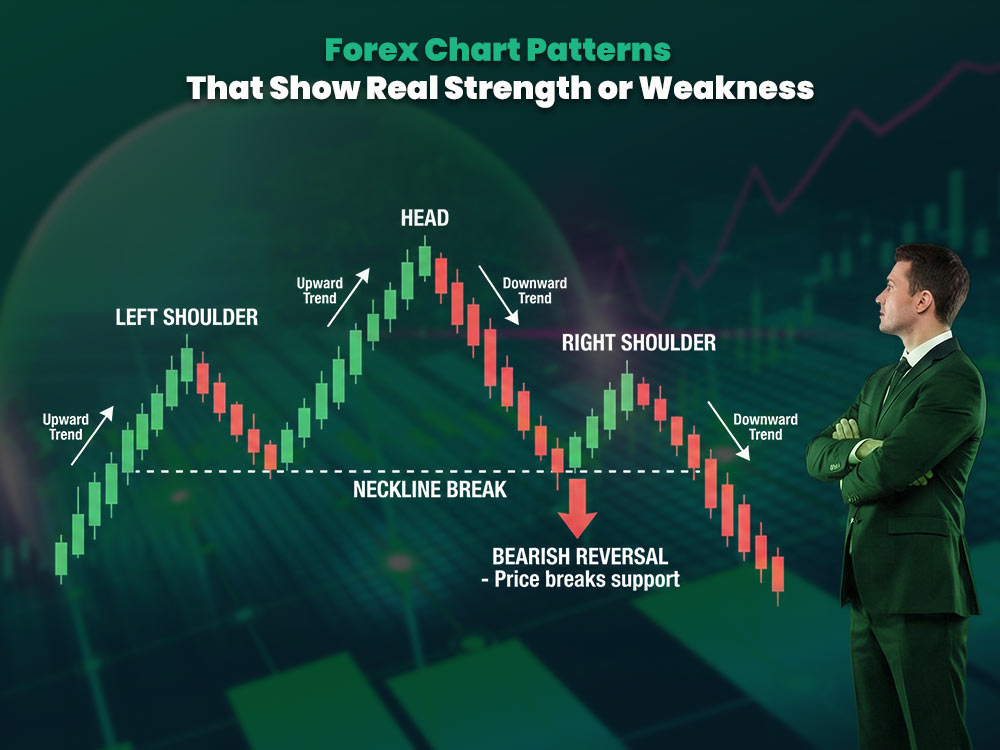
8. Head and Shoulders: Strong Reversal Pattern
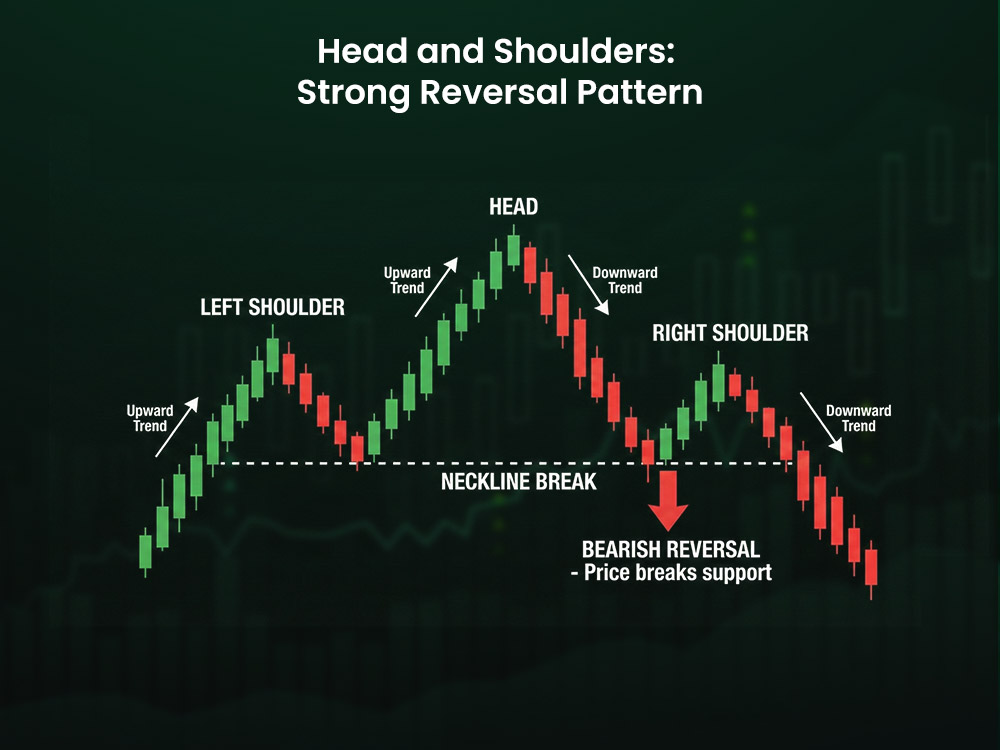
Head and Shoulders: Strong Reversal Pattern
The head and shoulders is one of the most well-known classic chart patterns. It signals weakness at the top of a trend.
Head and Shoulders Pattern signs:
- Strong left shoulder
- Taller head
- Weaker right shoulder
- Neckline break
The neckline is the key. Once price breaks it, the trend flips.
The inverse head and shoulders works the same way but signals strength at the bottom.
Head and Shoulders Example
For example, if USD/JPY forms a clear left shoulder near 145.20, drops to make a deeper low at 144.60 for the head, then makes a higher low around 145.00 for the right shoulder, it shows sellers failed to push price lower. When price breaks above the neckline with a strong candle, buyers often drive a steady move up.
9. Double Top: Clear Trend Exhaustion
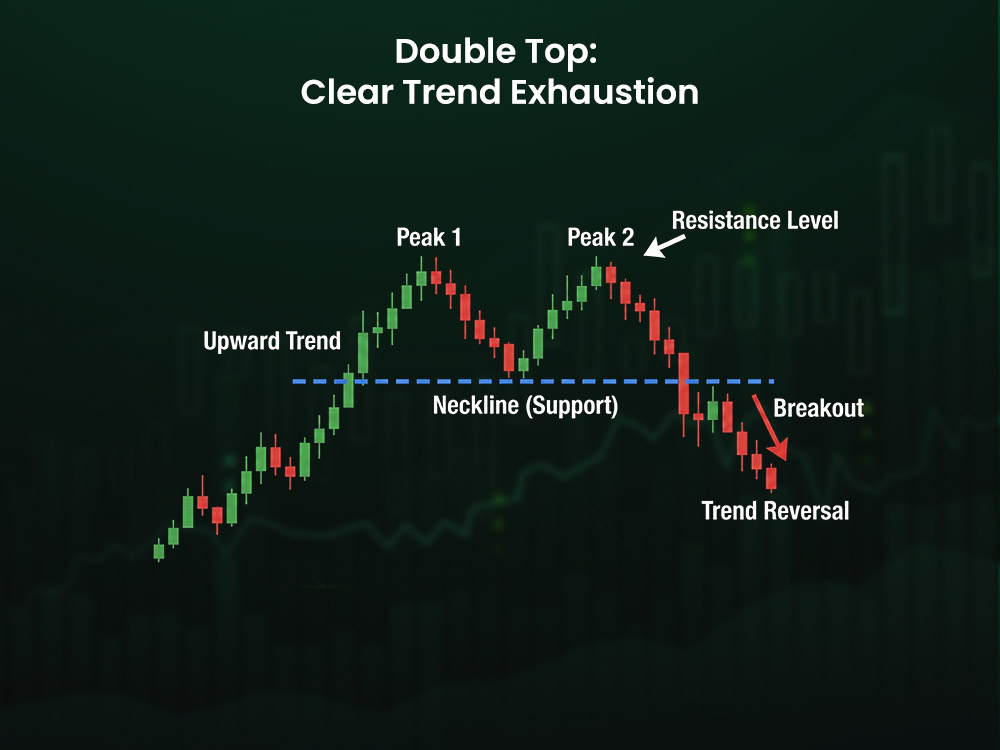
Double Top: Clear Trend Exhaustion
A double top shows price failed at the same zone twice. This is a strong weakness signal.
Double Top Pattern signs:
- Two peaks
- Middle support
- Sharp drop on break
This is one of the trade patterns that shows sellers are ready to take over, and it often marks the point where momentum flips hard in their favor.
10. Double Bottom: Strong Buy Signal
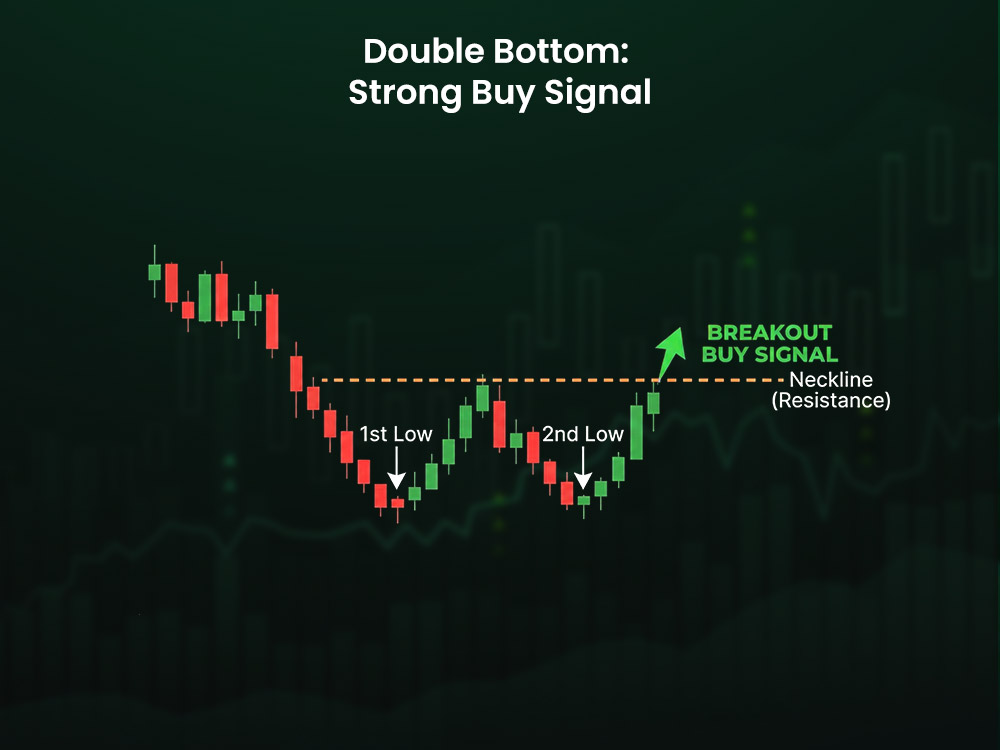
Double Bottom: Strong Buy Signal
A double bottom shows buyers reject lower prices twice. It is a clear strength signal.
Double Bottom Pattern signs:
- Two lows
- Middle resistance
- Breakout above the middle level
A double bottom with a long lower wick on the second low is very strong because it shows buyers stepped in with clear intent and shut down the sell-off fast.
Double Bottom Example
For example, if EUR/USD drops to 1.0700, bounces, and then comes back to 1.0700 again but forms a long lower wick before pushing up, it shows sellers failed twice. When price breaks above the middle line, buyers usually drive a clean move upward.
11. Rectangle Pattern: Strength or Weakness on Break
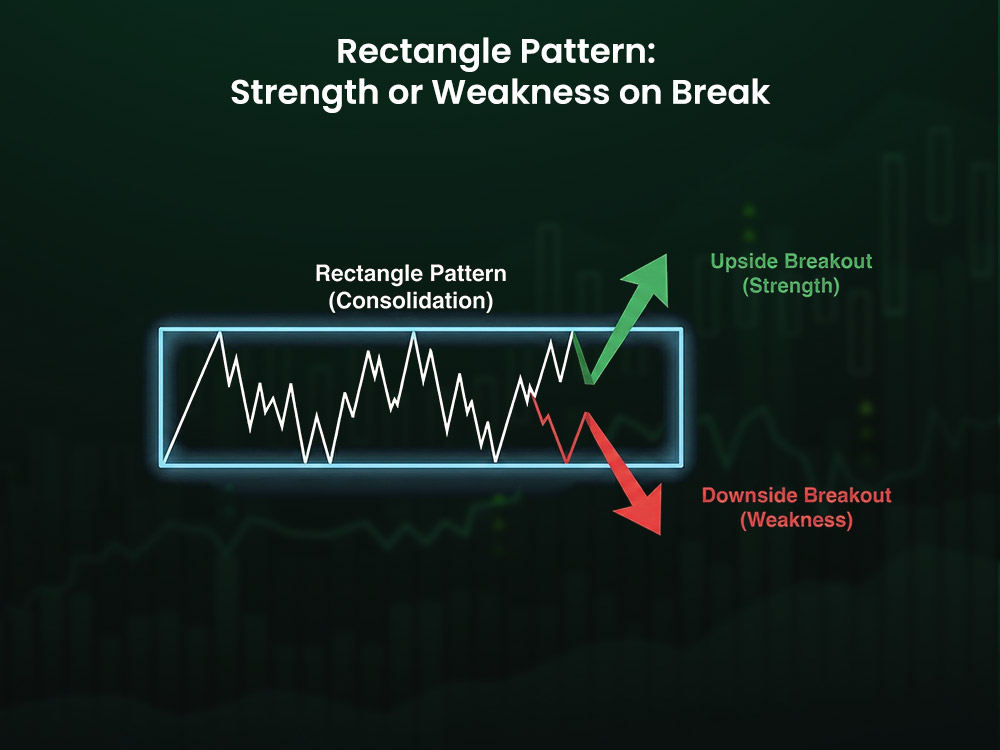
Rectangle Pattern: Strength or Weakness on Break
A rectangle is a range. Price moves sideways between support and resistance. The breakout shows who wins.
Rectangle Pattern signs:
- Clean break
- Smooth move
- No whipsaw
This is one of the simplest forex trading chart patterns and works well in all sessions. You can also study tight ranges and structure shifts through the pin bar pattern guide.
Rectangle Pattern Example
For example, if GBP/USD ranges between 1.2550 and 1.2600 for several hours and then breaks above 1.2600 with a strong candle, many traders enter long on the break. The move often continues clean because the range builds pressure before the breakout.
What Real Strength Looks Like in Forex Chart Patterns
To tell if a pattern has real force, look at:
1. Candle Size
Large candles show control. Small candles show hesitation.
2. Wicks
Long lower wicks show buyer strength.
Long upper wicks show seller strength.
3. Speed
Strong trends move fast.
4. Follow-Through
Real moves continue. Fake moves stall.
5. Retests
A clean retest that holds, shows strong conviction.
Patterns without these signs are weak patterns.
When You Should Avoid a Pattern
Skip a pattern when:
- Structure is messy
- Wicks are long and random
- Breakout lacks force
- Pattern forms into major support or resistance
- Trend before the pattern is unclear
- Breakout returns inside the shape right away
Weak different chart patterns often trick new traders. To avoid these traps, review the risk management practical guide. Stick to clean ones because they show clearer intent.
For example, if USD/EUR forms a messy range with random wicks around 1.0850, the breakout often fakes out both sides. But when the range is clean and price finally breaks above 1.0880 with a strong candle, buyers usually drive a smoother move because the structure had real pressure behind it.
How to Use Forex Chart Patterns in Real Trading
Here’s a simple checklist:
- Identify the pattern
- Make sure the shape is clean on the trading graph
- Wait for breakout and close
- Check for strength signs
- Place stop at the clean level
- Aim for a target based on pattern height
This keeps your trades simple and avoids guesswork because you follow clear steps instead of reacting to random moves.
Why Your Trading Deserves a Strong Partner
Reading forex chart patterns helps you see strength and weakness fast, which makes each trade feel more clear and controlled. When you follow clean shapes and wait for real breakouts, your decisions stay steady and simple. Partnering with forex brokers such as Dominion Options supports this style well with raw spreads from 0.1 pips, fast execution, and stable trading conditions that help you stay focused while running these setups.
FAQs: Forex Chart Patterns and Strength Signals
1. What are the most successful chart patterns?
Some of the most successful chart patterns include the bull flag, bear flag, ascending triangle, double bottom, and head and shoulders. They show strong control from one side and give clear breakouts.
2. Why do forex chart patterns matter?
They matter because they show strength or weakness before a big move. They help you make decisions based on structure, not hope.
3. Are chart patterns hard to learn?
They are simple once you understand how price forms shapes. With practice, you will see them fast.
4. Do trading patterns work on all timeframes?
Yes. These trade patterns appear on all forex trading charts, from one-minute to daily.
5. How do I know if a breakout is strong?
Look at candle size, wick behavior, and follow-through. Strong breakouts move clean and fast.
5. Do different chart patterns work better in trends?
Yes. Many patterns need a trend before forming. A bull flag or rising wedge means more when the trend is clear.