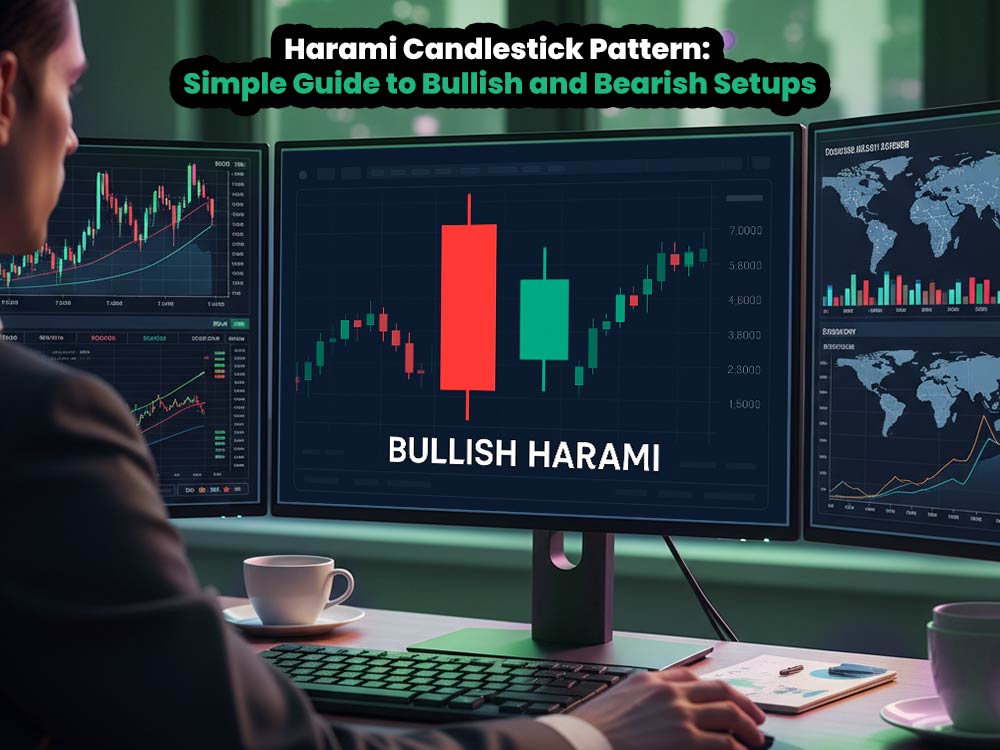
Harami Candlestick Pattern: Simple Guide to Bullish and Bearish Setups
Candlestick patterns give traders simple ways to read market mood. Among them, the harami candlestick stands out because it is easy to spot and can give early signs of reversal. It shows when market momentum is fading, often hinting that buyers or sellers may soon lose control. This makes it useful for traders looking for clear signals to plan entries, exits, or risk levels.
This article is a complete guide to the harami candlestick pattern, covering both bullish and bearish setups in detail. You’ll learn how it forms, why it matters, the psychology behind it, and how traders can use it with strategies and real examples.
Along the way, we’ll also mention how brokers like Dominion Options highlight the importance of risk tools and tight spreads, key features that support traders who rely on candlestick setups for decision-making.
What Is the Harami Candlestick?
What Is the Harami Candlestick
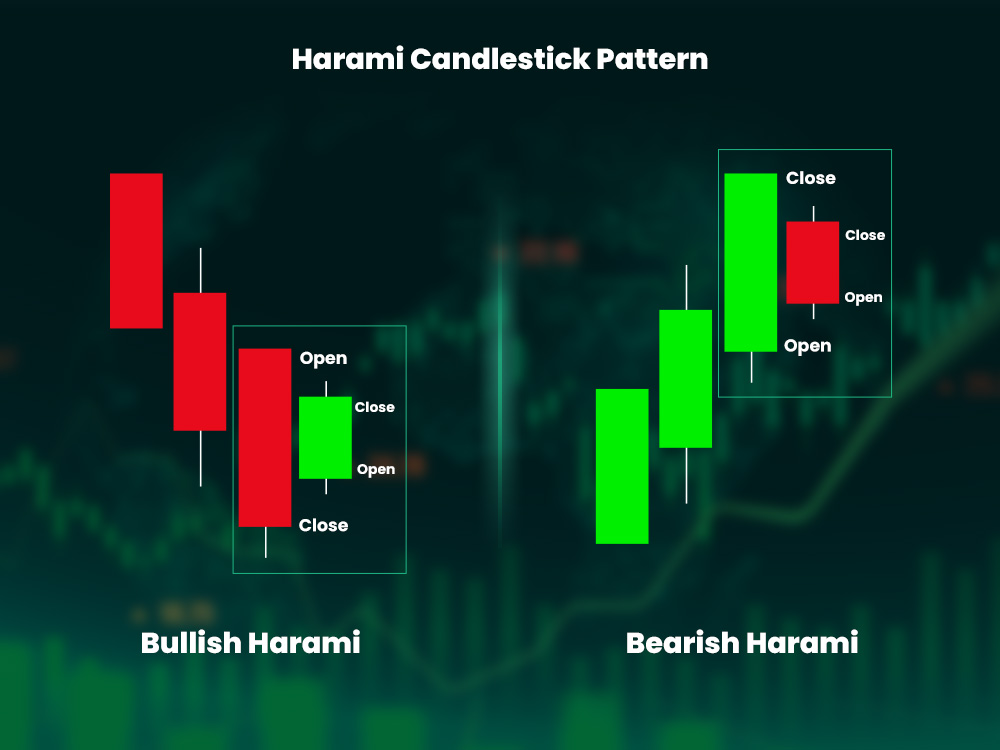
The word Harami means “pregnant” in Japanese. The harami candlestick pattern also known as the pregnant candlestick, looks like a mother and child, where the first candle represents the dominant move and the second shows hesitation inside it. The first candle is usually large, reflecting strong momentum, while the second is small and enclosed, suggesting indecision.
The Harami Candlestick is always made of two candles:
- Candle 1: A strong push in the direction of the trend, showing who is in control.
- Candle 2: A much smaller body that sits within Candle 1, showing that control is slipping.
When this smaller candle appears, it signals a pause. Momentum is fading, and the side that was driving the market is no longer as confident. That’s why the harami candlestick is read as a reversal pattern - it hints that a shift may be close.
Why the Harami Candlestick Pattern Matters
Why the Harami Candlestick Pattern Matters
Markets shift when one side loses power. Buyers push price up. Sellers push it down. When momentum weakens, the other side takes control.
The harami candlestick pattern highlights this shift. It matters because:
- It shows the trend is losing strength.
- It signals a possible change in direction.
- It gives traders an early warning to adjust.
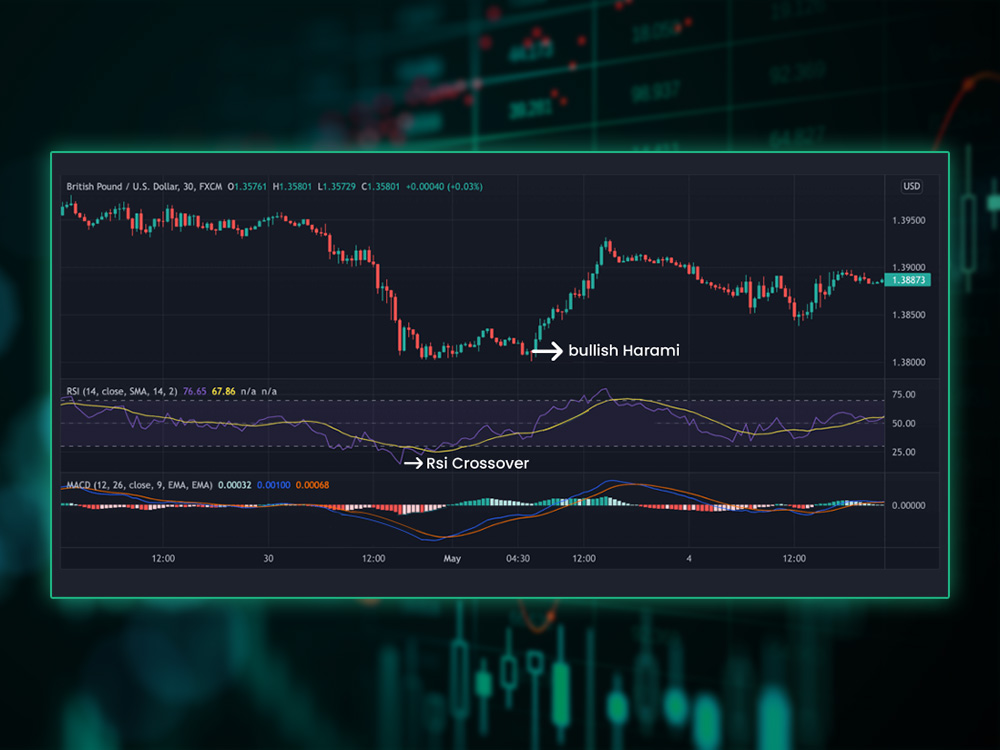
It is not the strongest candlestick pattern, but it earns trust when combined with confirmation signals. Traders who pair it with volume spikes, RSI, or support and resistance often find it much more reliable. This extra context helps filter out false alarms and makes the Harami a practical tool rather than just a chart curiosity.
Bullish Harami Candlestick Pattern Explained
Bullish Harami Candlestick Pattern Explained
The bullish harami candlestick pattern forms in a downtrend. It shows sellers may be losing strength.
- Day 1: A long red candle closes near the lows.
- Day 2: A small green bullish harami candle sits inside the red body.
This tells us sellers are no longer in full control. Buyers stepped in and slowed the fall.
Psychology of the Bullish Harami Candle
On day one, bears dominate. On day two, price holds steady and does not extend the fall. This shift surprises sellers and boosts buyer confidence. If the next session is bullish, a reversal may begin.
Trading the Bullish Harami Pattern
- Aggressive entry: Buy near the close of the second candle. Stop loss at the lowest low of the two candles. See a simple stop setup here: stop-loss in forex trading.
- Conservative entry: Wait for the next candle. Enter long if price breaks above the bullish harami candle high.
The bullish harami pattern works best when it forms at strong support zones or oversold conditions. You can explore more setups like this in our detailed guide on forex bullish candlestick patterns.
Bearish Harami Candlestick Pattern Explained
Bearish Harami Candlestick Pattern Explained
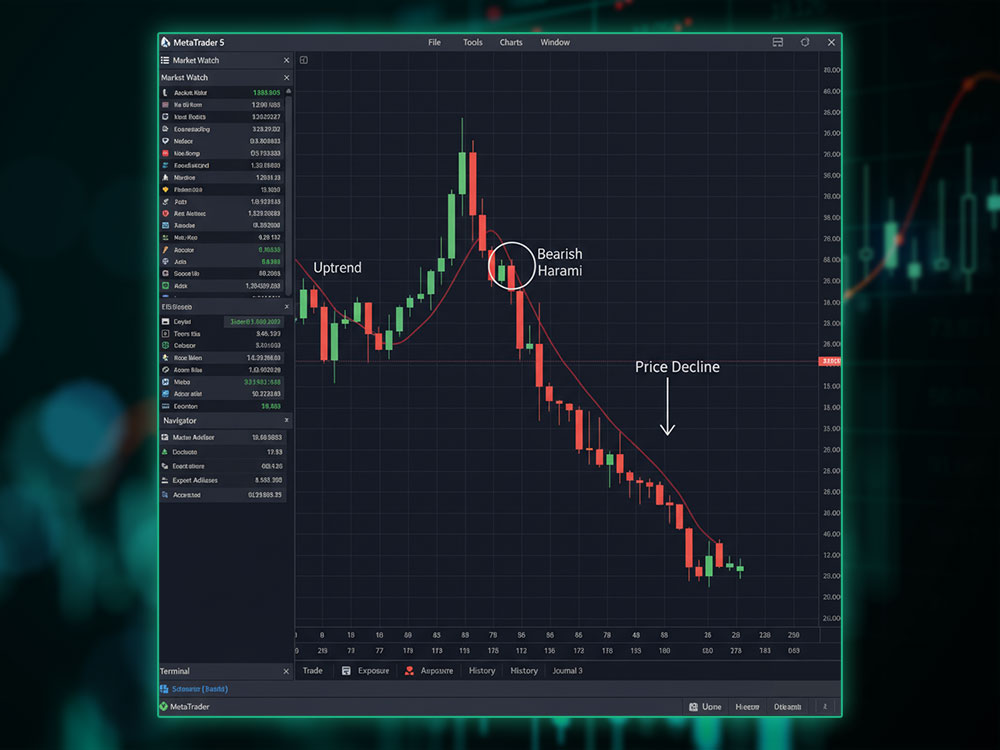
The bearish harami candlestick pattern forms in an uptrend. It shows buyers may be losing steam.
- Day 1: A long green candle closes near the highs.
- Day 2: A small red candle appears inside the green body.
This shift means the uptrend is weakening. If sellers confirm with more downside, a reversal begins.
Psychology of the Bearish Harami
On day one, bulls are strong. On day two, the market fails to push higher. Bears sense weakness. If price drops further, sellers take over.
Trading the Bearish Harami
- Aggressive entry: Short near the close of the second candle. Stop loss above the highest high of both candles.
- Conservative entry: Wait for the next day. Enter short if price breaks below the Harami low.
The bearish harami candlestick pattern is more effective when volume rises on the reversal day or when RSI shows overbought levels. For a deeper look at similar reversal setups, check out our blog on bearish candlestick patterns.
Real Example: Bullish Harami Pattern
Real Example: Bullish Harami Pattern
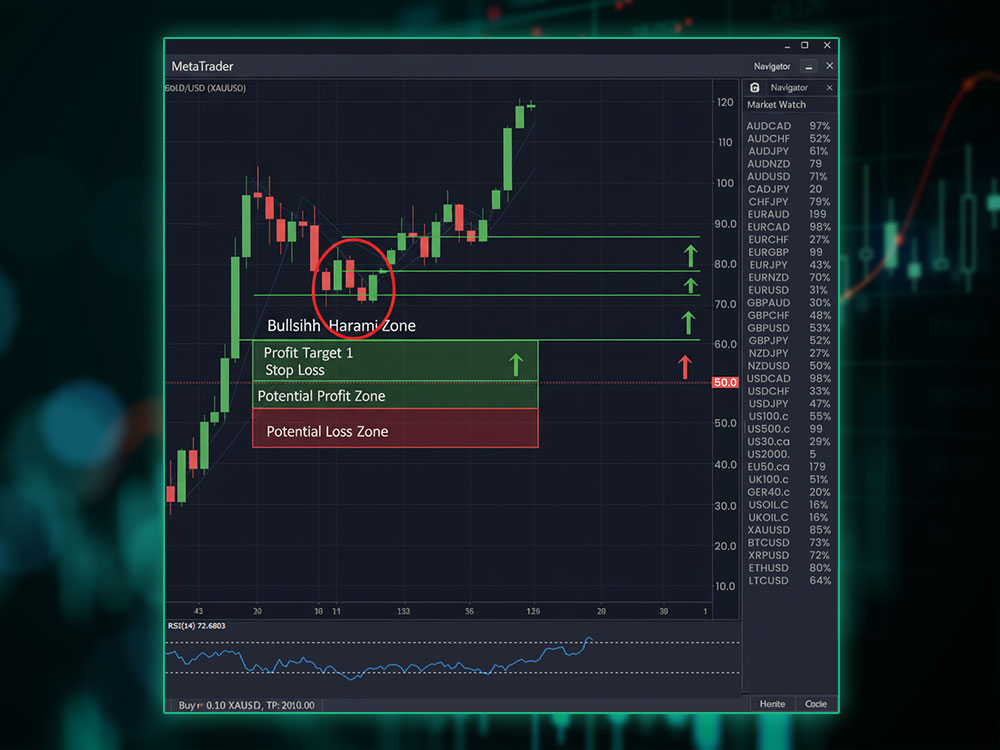
Consider Gold/USD in a downtrend. One session prints a long red candle as sellers stay in control. The next session forms a small green bullish harami candle completely inside the red body. RSI shows oversold. On the following day, price breaks above the green candle’s high.
A trader goes long, sets a stop just below the red candle’s low, and rides the rebound as gold climbs several dollars per ounce over the week. For step-by-step help, see forex trading strategies for gold.
Final Thoughts
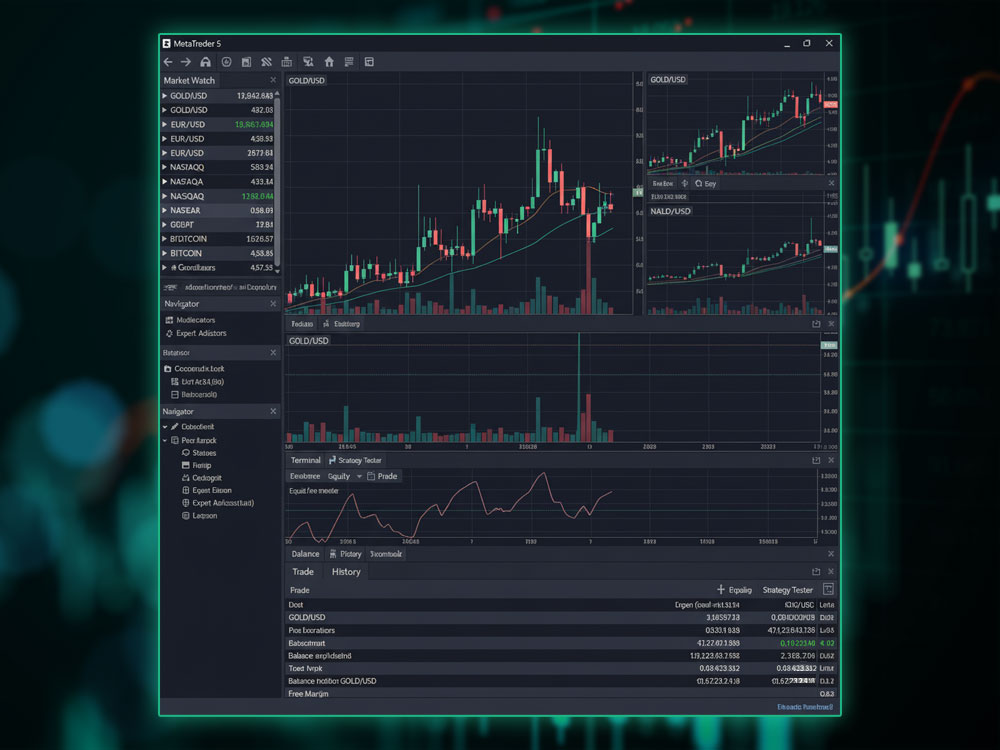
The harami candlestick is simple but powerful when used in the right way. For traders using forex trading platforms like Dominion Options, combining this pattern with the forex broker’s advantages such as low spreads, fast order execution, and access to popular trading platforms like MT5 can make setups more effective in real market conditions.
To summarize this, the bullish harami candlestick pattern warns of a possible end to selling, giving traders a chance to prepare for a bounce. The bearish harami candlestick pattern signals buyers may be losing power, hinting at a potential turn lower.
By spotting these setups, checking confirmation, and managing risk, traders can use the harami candlestick pattern as a reliable tool in their trading strategy.