
Pin Bar Candlestick Pattern: Key Strategy Tips for Better Entries
Trading is about reading price and reacting when the message is clear. One of the clearest and most powerful signals is the pin bar candlestick pattern. It shows rejection, emotion, and momentum shift - all in a single candle.
This guide explains what is pin bar candlestick, how to identify it, and how to use it in your pin bar candlestick pattern strategy for better entries and higher accuracy.
At Dominion Options, traders can apply these strategies directly within their advanced trading environment, benefiting from ultra-low spreads, fast execution, and flexible account types designed for precision entries and strategy testing.
What Is a Pin Bar Candlestick?
A pin bar candlestick pattern is a single candle with a small body and a long wick or shadow. That wick shows strong price rejection. Price tested a level but couldn’t hold, hinting at a possible reversal.
If the tail points down, it means buyers stepped in and rejected lower prices - forming a bullish pin bar candlestick.
If the tail points up, sellers pushed back - that’s a bearish pin bar.
Each pin bar candlestick reversal pattern shows a fight between buyers and sellers, and who is likely to win next.
A valid pattern usually has:
- A long wick that covers two-thirds or more of the candle length.
- A small body near one end.
- Little to no wick on the opposite side.
The longer the tail, the stronger the signal.
Why the Pin Bar Candlestick Pattern Works
Why the Pin Bar Candlestick Pattern Works
The pin bar candlestick pattern works because it captures real trader behavior. It shows where one side lost control and the other side took over.
Imagine a downtrend. Price drops, but before the candle closes, buyers rush in and push price higher. That candle leaves a long lower wick and a small body - a clear bullish pin bar candlestick. It signals sellers failed to hold their ground.
The same logic applies to bearish setups - when buyers lose control near resistance, forming a long upper wick.
This is why many traders rely on the pin bar candlestick indicator or visual identification of the pattern - it shows rejection and intent in real time.
Pin Bar vs. Doji Candle
Many confuse a pin bar with a doji, but they mean different things.
- A doji shows indecision - open and close near the middle.
- A pin bar candlestick shows rejection - open and close near one end, with a clear dominant wick.
The doji candlestick pattern says “no clear winner.” The pin bar says “one side just lost control.”
That’s why the pin bar candlestick pattern strategy focuses on decisive reversals, not uncertainty.
Where the Pin Bar Candlestick Pattern Works Best
You’ll get the most reliable signals when the pin bar candlestick pattern forms at meaningful price zones. Look for these key spots:
Support and Resistance
- Bullish pin bars near support signal possible rebounds.
- Bearish pin bars at resistance signal rejection of higher prices. Read this blog about support and resistance indicators to better understand how the setup occurs.
Trend Lines
- When a pin bar touches a trend line and rejects it, it shows strength in the main direction.
Moving Averages
- Pin bars forming near the 20- or 50-MA can act as bounce points.
Fibonacci Levels
- Patterns near 38.2% or 61.8% retracements often mark reversals.
Psychological Levels
- Round numbers like 1.1000 in forex often attract large reactions.
These zones are where the pin bar candlestick reversal pattern works best.
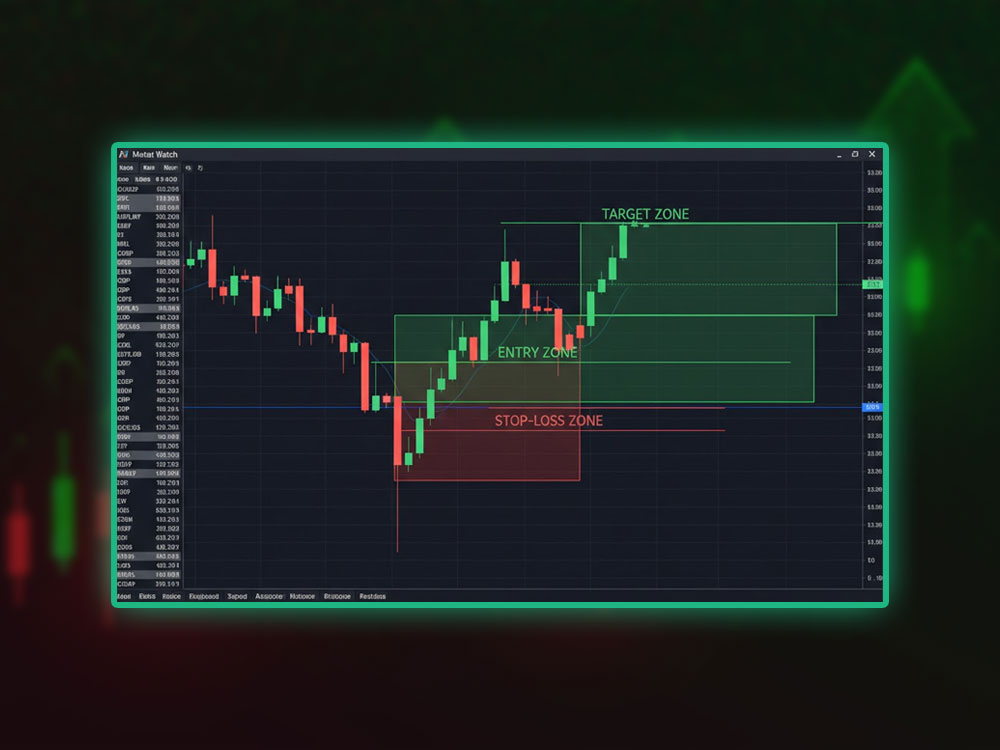
Bullish Pin Bar Candlestick Setup
Bullish Pin Bar Candlestick Setup
A bullish pin bar candlestick shows buyers rejecting lower prices and preparing to push up.
Structure:
- Long lower wick.
- Small body near the top.
- Appears after a decline or near support.
How to trade it:
- Wait for the candle to close.
- Mark its high and low.
- Place a buy stop above the high.
- Put your stop-loss under the tail.
- Target at least twice your risk.
This forms the core of a pin bar candlestick pattern strategy in an uptrend. Traders often compare it to the Harami candlestick pattern when studying bullish reversal setups, as both can highlight early signs of trend change with subtle differences in candle structure.
Bearish Pin Bar Candlestick Setup
Bearish Pin Bar Candlestick Setup
A bearish pin bar candlestick forms when sellers reject higher levels.
Structure:
- Long upper wick.
- Small body near the bottom.
- Appears after a rally or near resistance.
How to trade it:
- Wait for the close below the high.
- Place a sell stop below the low.
- Put your stop-loss above the tail.
- Target 2–3× your risk or the next support.
This method works best in established downtrends or near strong resistance zones, similar to how traders analyze a bearish candlestick pattern to confirm momentum shifts.
Three Entry Styles in the Pin Bar Candlestick Pattern Strategy
Every trader handles entries differently. The pin bar candlestick pattern allows three clear approaches:
1. Market Entry
Enter right after the candle closes. It’s quick but sometimes premature.
2. Retrace Entry
Wait for a 50% retracement of the pin bar’s range.
This gives a better entry and tighter stop but risks missing the trade.
3. On-Stop Entry
Use a pending order above (for bullish) or below (for bearish) the candle.
It confirms momentum in your favor before entry.
Choose what fits your trading style - or test all three with your pin bar candlestick indicator.
Higher Timeframes, Cleaner Signals
While pin bar candlestick reversal patterns appear on every chart, quality differs.
Higher timeframes (4-hour, daily, weekly) produce stronger, cleaner signals.
Lower timeframes often give noise and false setups.
If you’re new, start with daily charts. The context is clearer, and patience pays.
Using the Trend with the Pin Bar Candlestick Pattern
Trade with the trend, not against it.
- In an uptrend, focus on bullish pin bar candlesticks that form during pullbacks.
- In a downtrend, look for bearish ones during rallies.
Counter-trend pin bars can work, but they require confluence - strong support, resistance, or volume confirmation.
Following the main trend keeps your pin bar candlestick pattern strategy simple and consistent.
Key Confirmation Tools
Enhance your setup with confirmation factors:
- Volume spikes: high volume confirms strong rejection.
- Moving averages: alignment adds confluence.
- Next candle confirmation: when the following candle moves in the same direction, the signal strengthens.
- Multiple tests: if the level was tested before, the rejection carries more weight.
Adding these filters makes your pin bar candlestick pattern trades more selective and accurate. It is very important to be educated how to use trading indicators to improve you entries.
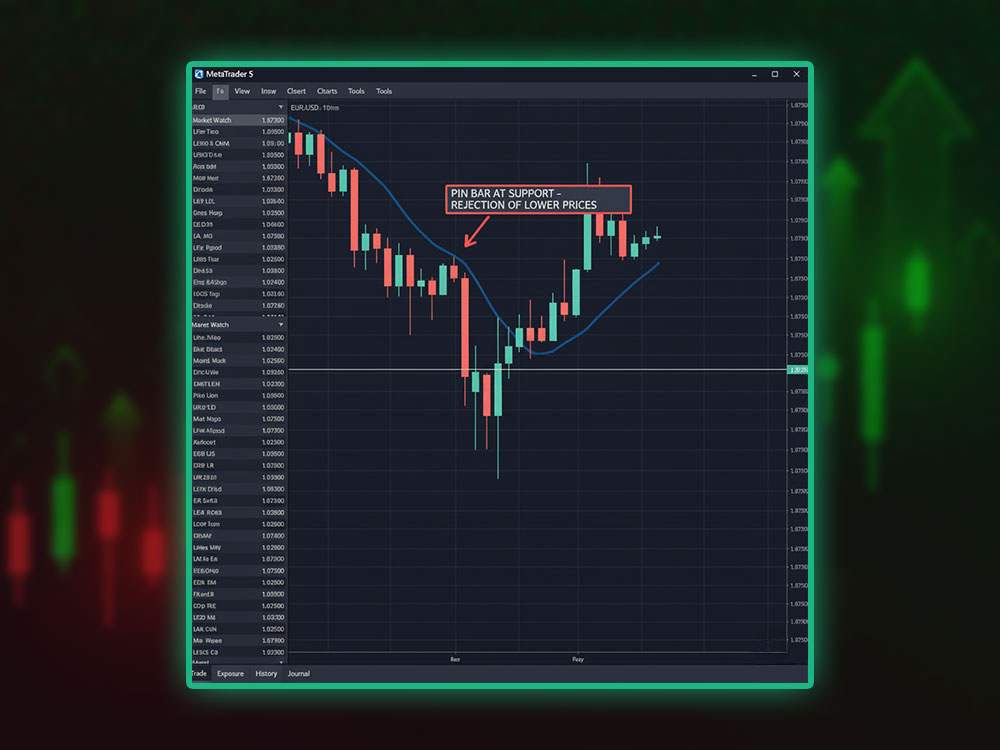
Real Example: Bullish Pin Bar at Support
Bullish Pin Bar at Support
Imagine EUR/USD falling toward 1.0800 support. A long lower wick forms, closing near the top - a textbook bullish pin bar candlestick.
You set a buy stop above its high, stop-loss under the tail, and target the next resistance. When price rallies, your pin bar candlestick pattern strategy delivers clean profits with limited risk.
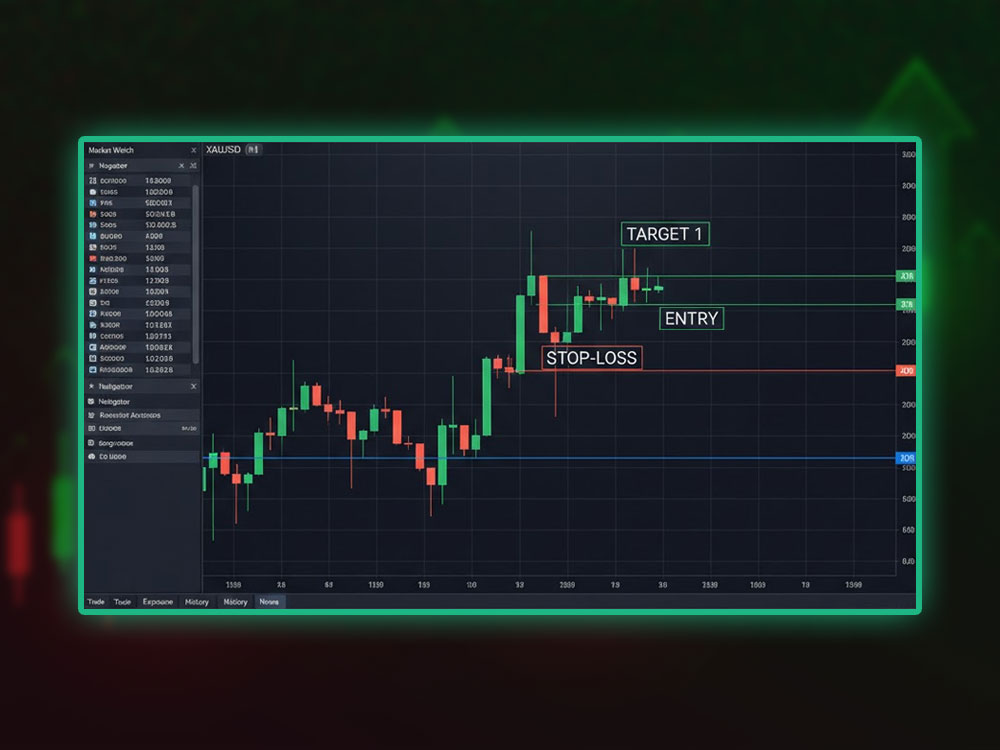
Real Example: Bearish Pin Bar at Resistance
Bearish Pin Bar at Resistance
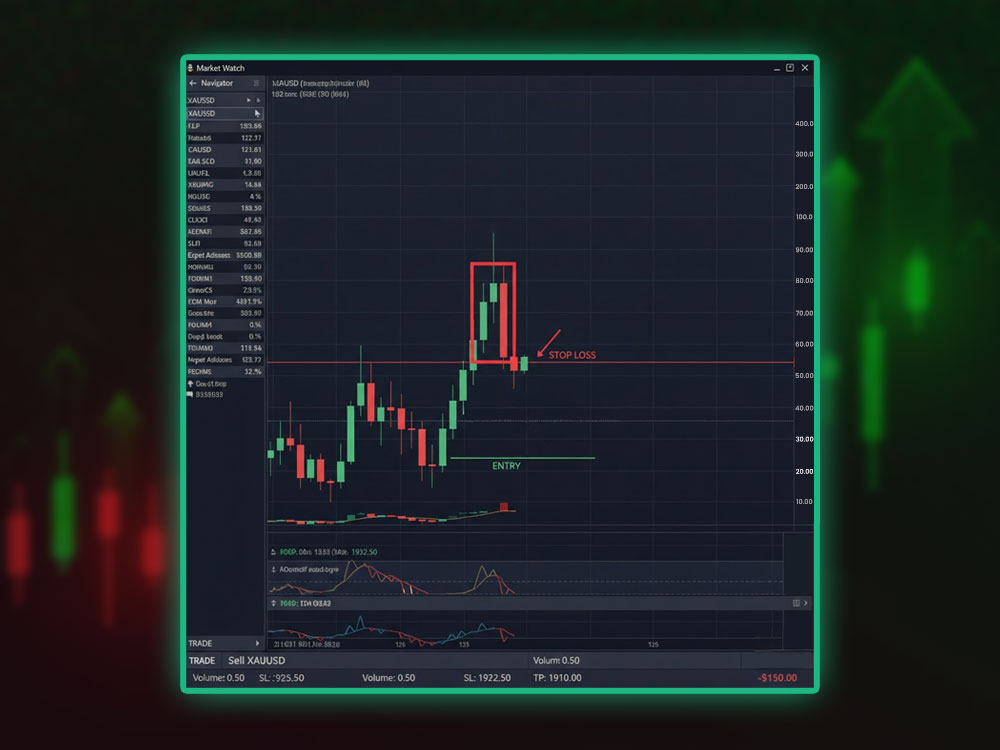
Gold rallies to $2,400 and forms a bearish pin bar candlestick with a long upper wick.
Sellers reject that level.
You enter short below the low and place your stop above the wick.
When price drops to $2,350, the pin bar candlestick reversal pattern completes successfully.
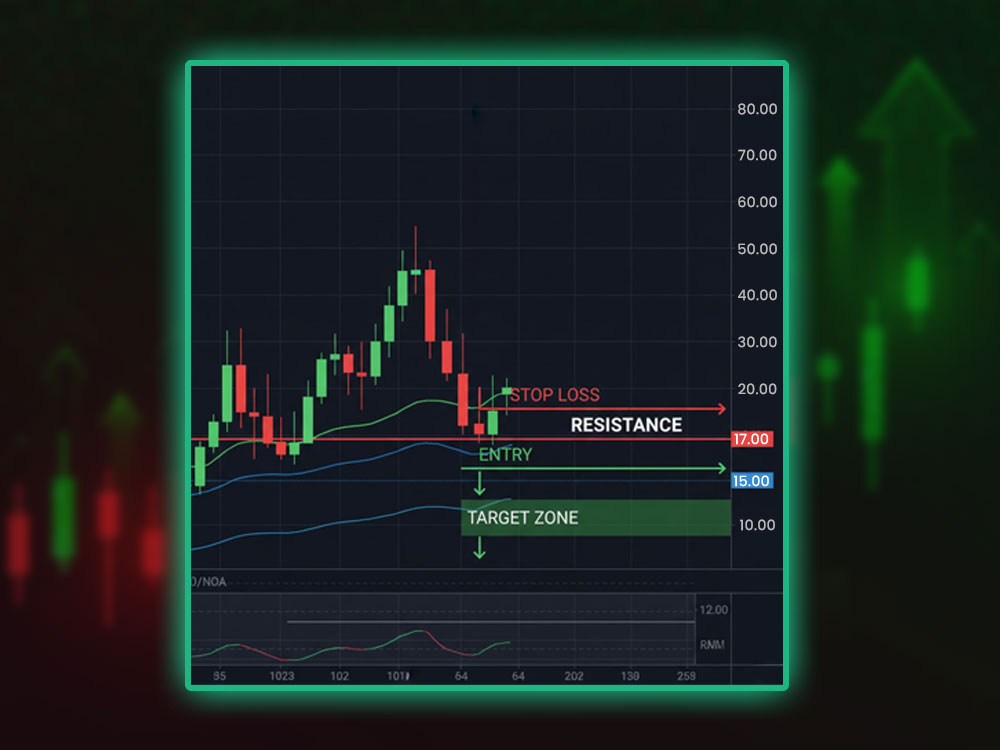
Stop-Loss, Targets, and Risk Control
Every trade needs protection.
In any pin bar candlestick pattern strategy, stop-loss placement matters more than entry.
- For bullish setups, place stop below the tail.
- For bearish setups, place stop above the tail.
Aim for at least a 1:2 risk-to-reward ratio.
That way, even if half your trades fail, you stay profitable.
Don’t move stops too early. Pin bars often retest before taking off.
Common Mistakes in the Pin Bar Candlestick Pattern Strategy
-
Trading every pin bar
Only trade those forming near strong support or resistance.
-
Ignoring trend direction
Counter-trend trades are riskier. Stick with the main flow.
-
Entering before close
Wait for the candle to complete - it’s not a pin bar until it closes.
-
Stops too tight
Give your trade room. Small stops often get hit before the move starts.
-
No clear exit plan
Always define targets before entering. Discipline beats luck.
Avoid these errors, and your pin bar candlestick pattern results will improve. These mistakes are also common when reading other reversal setups such as the hanging man and hammer, which share similar price rejection behavior but form under different market conditions.
Pin Bar Candlestick Reversal Pattern in Different Markets
This pattern isn’t limited to forex. The pin bar candlestick pattern works in stocks, crypto, and indices too.
- Forex: Focus on major pairs with tight spreads.
- Stocks: Pin bars after news or earnings can show strong reversals.
- Crypto: Expect more volatility; use wider stops and smaller position sizes.
The principle stays the same - rejection, confirmation, and controlled risk.
Moving Averages and Pin Bar Candlestick Indicator
Combining the pin bar candlestick indicator with moving averages filters bad trades.
- When price is above the MA, trade bullish pin bar candlesticks.
- When price is below the MA, trade bearish ones.
This alignment keeps you trading with the main market flow and reduces false setups.
Multiple Timeframe Strategy
Pro traders often combine timeframes for extra precision.
- Spot a pin bar candlestick on the daily chart.
- Drop to 1-hour or 30-minute to fine-tune entry.
- Confirm with the pin bar candlestick indicator for better timing.
This approach keeps your analysis broad but your entry sharp.
Risk Management in Every Trade
Even the best pin bar candlestick pattern fails sometimes. Your edge comes from consistency and controlled loss.
- Risk only 1–2% per trade.
- Use proper position sizing.
- Don’t double down on losses.
- Track your results and refine your rules.
Over time, your pin bar candlestick pattern strategy becomes more accurate with proper trading risk management.
The Psychology Behind the Pin Bar Candlestick Reversal Pattern
Each pin bar candlestick reversal pattern shows emotion and traps. When buyers or sellers get caught on the wrong side, they rush to exit, adding fuel to the new move.
That’s why reversals after pin bars are often quick and clean - panic exits create fast trends.
Once you understand this, the pattern stops being just a shape and becomes a story of pressure and control.
Final Thoughts
The pin bar candlestick pattern remains one of the most powerful tools in price action trading.It reveals rejection, momentum shifts, and trader psychology in one glance.
At Dominion Options, traders can use this setup on fast execution platforms with deep liquidity, helping them apply price action strategies like pin bars more effectively.
This combination of advanced tools and conditions makes Dominion Options stand out among the best forex broker options for traders seeking professional-grade performance.
Follow the pin bar candlestick pattern strategy, respect your stops, and trade with patience.
With time, you’ll see that mastering the pin bar candlestick pattern isn’t about predicting the market — it’s about reading it.
FAQs About the Pin Bar Candlestick Pattern
1. What is Pin Bar Candlestick?
A pin bar candlestick is a price pattern with a small body and a long wick that shows rejection.
It’s used to spot reversals and entry points
2. How Do You Trade the Pin Bar Candlestick Pattern?
Wait for the candle to close.
Enter above or below the pin bar depending on direction.
Place stops beyond the wick and target at least 2× your risk.
3. Is the Pin Bar Candlestick Indicator Reliable?
Yes, when used with confluence like support, resistance, or trend direction.
It’s one of the simplest yet most reliable price action indicators.
4. What Makes a Bullish Pin Bar Candlestick Strong?
A long lower wick, clear rejection of support, and confirmation from the next candle.
It shows buyers have regained control.
5. Can the Pin Bar Candlestick Pattern Be Used in All Markets?
Yes. Forex, stocks, crypto - the logic stays the same: rejection and reversal.