Inverted Hammer Candlestick: Everything Traders Should Know
Candlestick patterns show how price moved during a session, nothing more. They do not predict what comes next. They only show who pushed harder, buyers or sellers. One pattern that trips traders up more than most is the inverted hammer candlestick.
The inverted hammer candlestick looks harmless on the chart, which is exactly why traders misuse it. Many spot the candle and react without looking at the trend or waiting for proof. That approach usually leads to bad trades. When the context is right, though, this candlestick can hint that selling pressure is losing strength.
This guide explains what the inverted hammer candlestick is, how it forms, what it tells you about market behavior, and how traders commonly use it. Nothing here is theory heavy or filled with jargon. The focus stays on clear price action and practical understanding, the same approach traders apply when studying clean chart setups on platforms like Dominion Options where tight spreads, fast execution, and reliable charting tools matter more than noise.
What Is an Inverted Hammer Candlestick
What Is an Inverted Hammer Candlestick
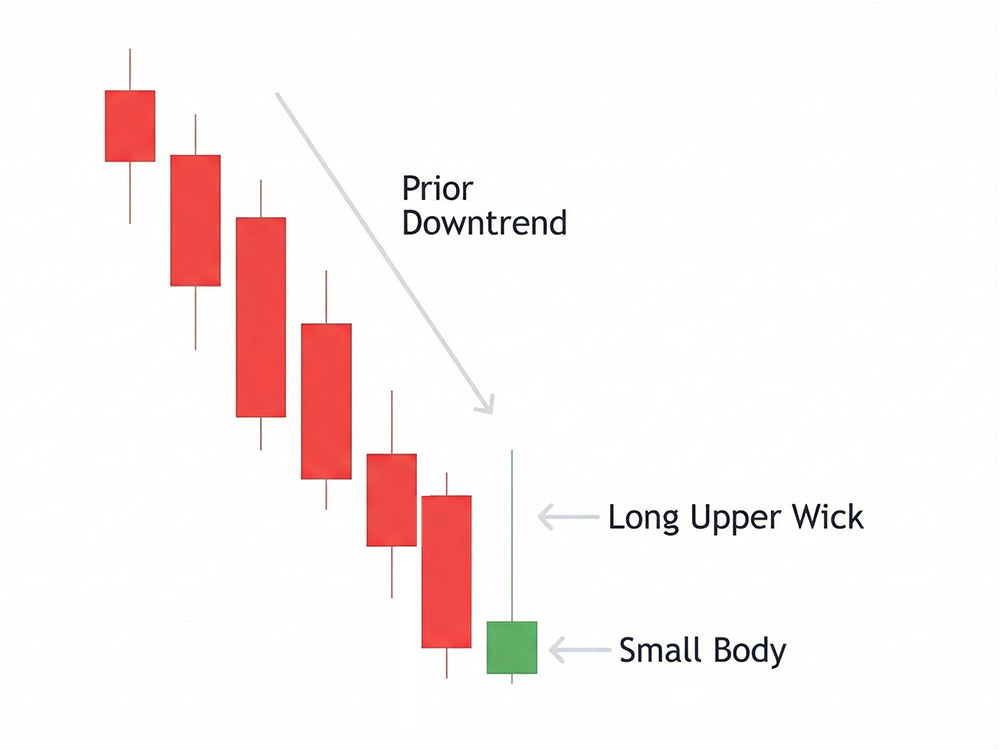
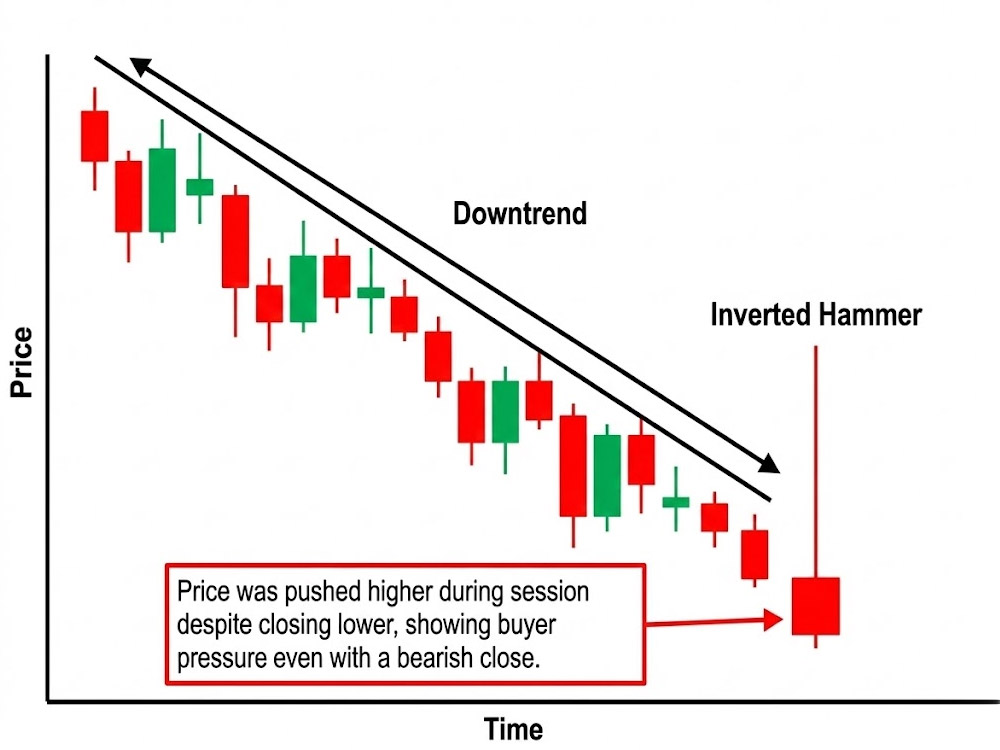
An inverted hammer is a single candlestick pattern that appears after a downtrend. Traders view it as a possible bullish reversal signal, but only when the context supports it. Many traders build this foundation by first learning how to analyze forex bullish candlestick patterns before relying on individual reversal candles.
The candle has three key features:
- A small real body near the bottom of the price range
- A long upper wick
- Little to no lower wick
The long upper wick should be at least twice the size of the candle body. If the upper wick is short, the candle loses its meaning.
The name comes from its shape. It looks like a hammer turned upside down. While the shape is easy to spot, the meaning depends fully on where it forms on the chart.
Where the Inverted Hammer Candlestick Must Appear
Context matters more than shape.
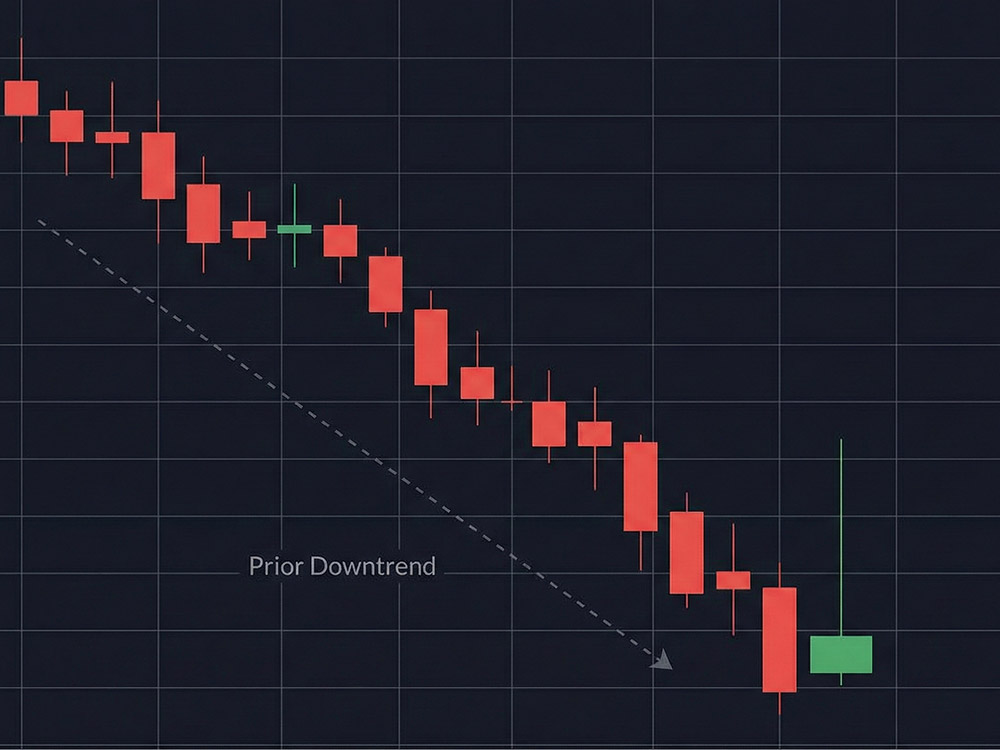
An inverted hammer only carries meaning after a clear downtrend. If it forms in the middle of sideways movement or after a rally, it is not an inverted hammer signal. In that case, it is just another candle.
A valid downtrend usually shows:
- Lower highs
- Lower lows
- Price trading below recent resistance
Without a prior decline, the candlestick does not signal a reversal. It becomes noise.
Example Trade With XAU/USD
Example Trade With XAU/USD
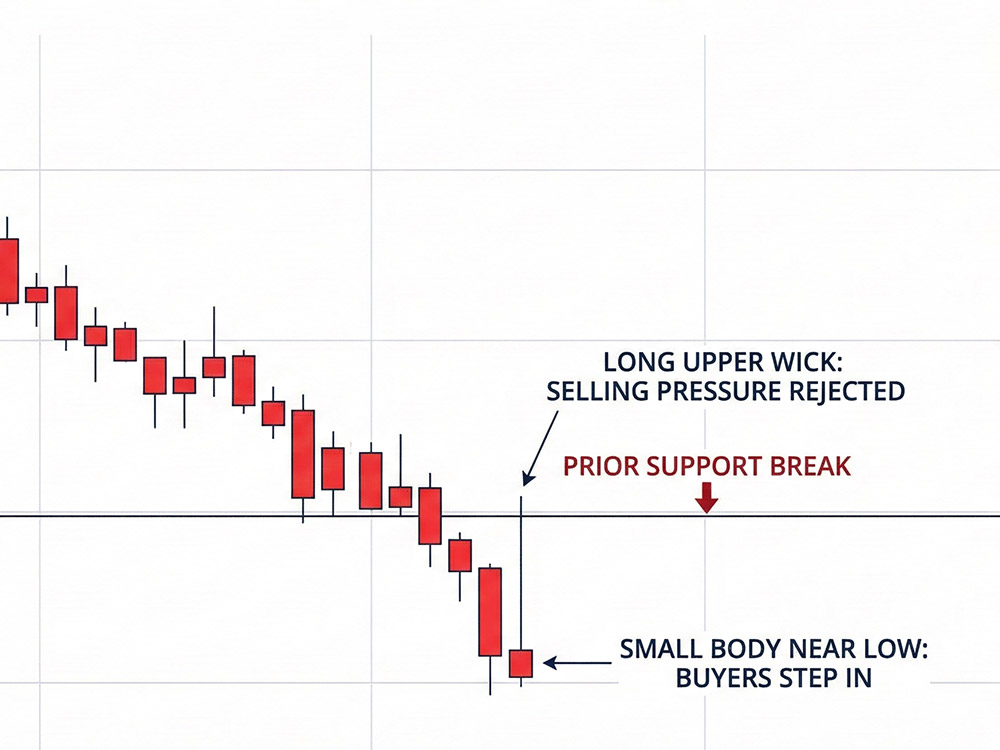
For example, on a Gold/USD chart, price may fall for several sessions, break below a prior support level, and continue printing lower highs. Sellers control most of the move, and each bounce gets sold quickly. If an inverted hammer forms after that drop, near a recent low, it shows that buyers managed to push price higher during the session for the first time in a while.
Even if price closes near the open, the long upper wick shows that selling pressure was challenged. Without that clear sell-off on Gold/USD and visible buyer response, the same candle would carry little weight.
For traders who want a deeper breakdown of price behavior in metals, trading gold forex strategy can help you understand how to approach this better.
What the This Candlestick Pattern Shows About Price Behavior
To understand this candlestick pattern, focus on what happened during the session.
At the start, sellers remain in control and push price lower, continuing the downtrend. Then buyers step in with enough force to push price higher during the same session. That push creates the long upper wick.
By the close, sellers manage to pull price back down near the open. This explains the small real body near the bottom.
The key takeaway is not where the candle closes. The key is that buyers were strong enough to challenge sellers after a period of steady selling.
This shift does not mean buyers have taken control. It means selling pressure may be weakening.
Why Traders See It as a Bullish Signal
The inverted hammer Candlestick suggests a change in behavior, not a confirmed trend change.
In a downtrend, sellers usually control every session. When price suddenly moves higher during a session, even if it fails to close high, it shows buyers are no longer passive.
This is why traders treat this candle as an early warning, not a buy signal by itself.
It hints that the downtrend may be losing strength, especially if it forms near support or after a sharp sell-off.
Bullish vs Bearish Inverted Hammer Candles
This candlestick can close either green or red. Many traders believe only green candles matter. That idea is wrong.
Green Inverted Hammer Candlestick
Green Inverted Hammer Candlestick
A green inverted hammer Candletick closes above the open and is slightly stronger
Red Inverted Hammer Candlestick
Red Inverted Hammer Candlestick
A red inverted hammer Candlestick closes below the open but still carries meaning
Both versions can signal the same potential shift because the message comes from the long upper wick, not the close.
Traders should focus on structure, not color.
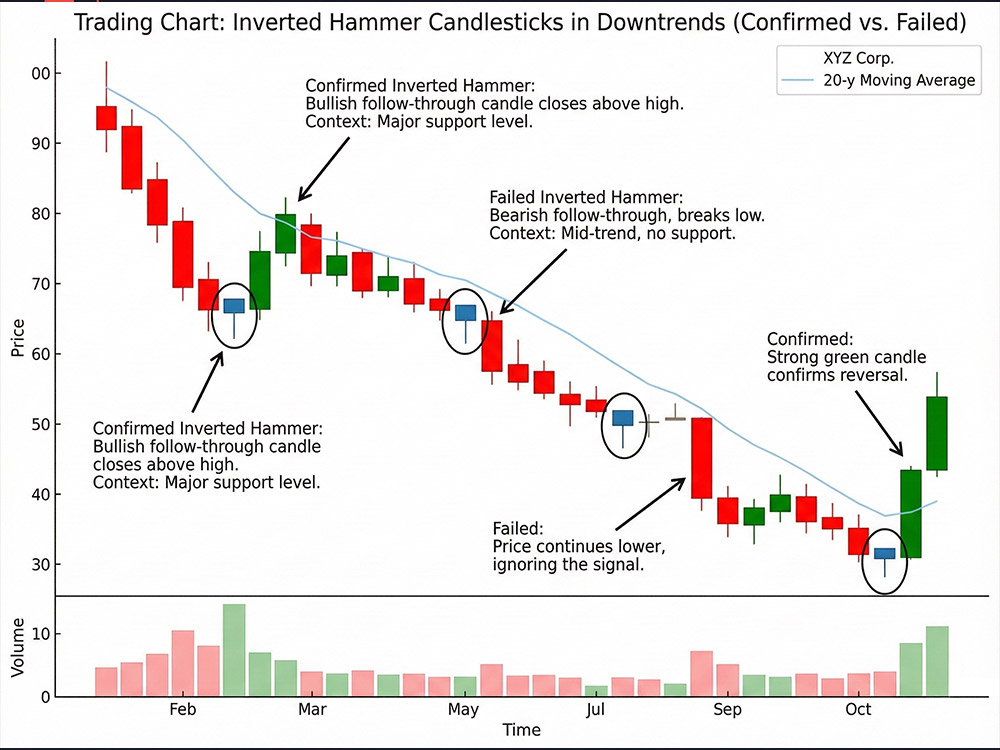
Confirmation Is Not Optional
The biggest mistake traders make with the inverted hammer is entering too early.
This reversal candle must be confirmed. Confirmation usually comes from the next candle. Many traders combine this step with tools discussed in best indicators for intraday trading to avoid acting too early.
Confirmation usually comes from the next candle. Traders look for:
- A close above the inverted hammer’s high
- Strong follow-through buying
- Reduced selling pressure
Without confirmation, this candlestick is only a hint. Many inverted hammers fail and price continues lower.
Waiting for confirmation protects traders from false signals.
How Traders Commonly Enter Trades
There are two common entry styles, depending on risk tolerance.
Conservative Entry
- Wait for the next candle to close above the inverted hammer’s high
- Enter after the close or on a small pullback
This approach reduces false entries but may miss part of the move.
Aggressive Entry
- Enter as soon as price breaks above the inverted hammer’s high
- Accept higher risk in exchange for better reward potential
This method suits experienced traders who manage risk well.
Stop Loss Placement
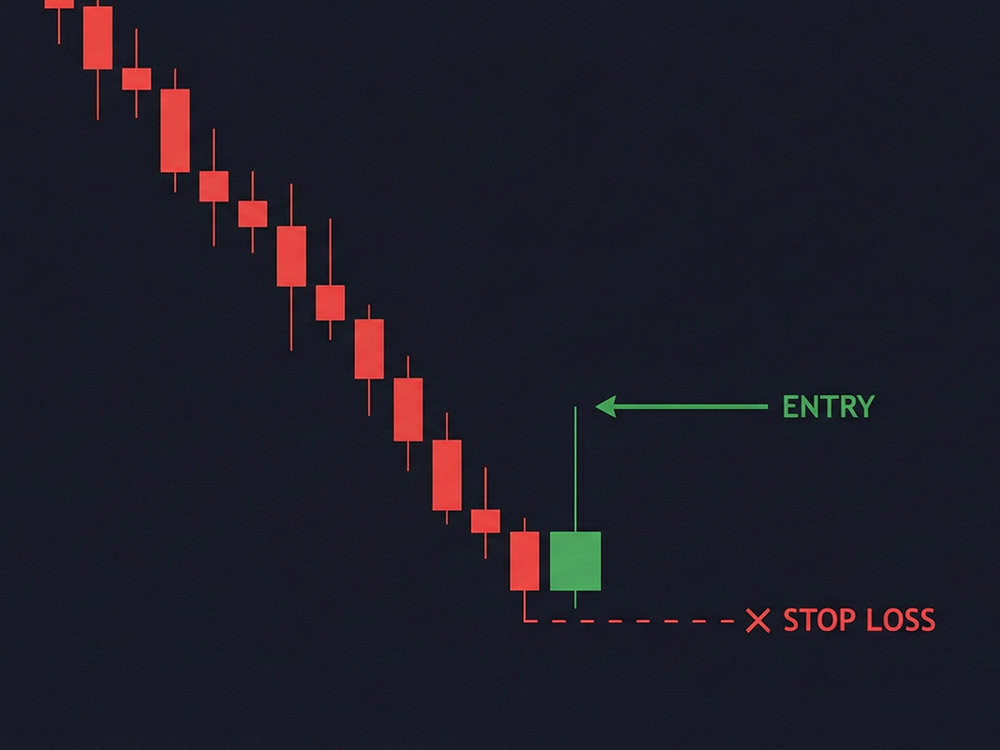
Stop Loss Placement
Risk control matters more than the entry.
A common stop loss location is below the low of the inverted hammer. This level represents the point where buyers failed to defend price.
If price breaks below that low, the reversal idea no longer holds.
Traders should avoid placing stops too tight, as this candlestick often retest lows before moving higher.
Profit Targets and Trade Management
The inverted hammer Candlestick does not give profit targets by itself.
Traders usually rely on:
- Nearby resistance levels
- Prior swing highs
- Measured moves from the downtrend
Some traders trail stops as price moves higher, locking in gains while allowing room for price to breathe.
There is no single correct approach, but all methods require discipline. Traders who want a clearer framework for managing exits often refer to the best risk to reward ratio in trading, which can be found in a separate guide.
Best Market Conditions for the Inverted Hammer Candlestick Pattern
This candlestick pattern works best under specific conditions.
Strong environments include:
- Clear downtrends
- Sharp sell-offs followed by slowing momentum
- Price near support zones
Weak environments include:
- Sideways markets
- Low volume sessions
- Choppy price action
The cleaner the trend, the more useful the signal becomes.
The Role of Volume
Volume adds clarity but is not required.
An inverted hammer with higher volume than recent candles shows stronger participation from buyers. This improves the odds of follow-through.
Low volume does not invalidate the pattern, but it lowers confidence.
Traders should use volume as support, not as a rule.
Inverted Hammer vs Shooting Star
These two patterns look the same but mean opposite things.
- Inverted hammer forms after a downtrend and hints at a bullish shift
- Shooting star forms after an uptrend and hints at a bearish shift
The difference is context, not shape. Confusing the two leads to trades taken in the wrong direction.
Always ask one question before acting: What was price doing before this candle formed?
This is easier to understand when compared alongside related candles covered in how to trade the hammer and hanging man candlestick patterns.
Inverted Hammer vs Hammer
Both patterns appear after downtrends, but they reject price from different sides. Traders who already understand rejection-based candles like the pin bar candlestick usually grasp this distinction faster
- Hammer has a long lower wick and small body near the top
- Inverted hammer has a long upper wick and small body near the bottom
Both show rejection, but from different sides of the range.
Some traders prefer the hammer because it shows buyers defending lows more clearly. Others use both patterns as early warning signs.
Common Mistakes Traders Make
Many losses come from misuse, not bad luck.
Ignoring Trend Context
Taking inverted hammers in sideways markets leads to random results.
Skipping Confirmation
Entering on the candle close without follow-through exposes traders to traps.
Using It Alone
It works best when combined with support, trend lines, or momentum clues.
Overtrading the Pattern
Seeing it everywhere weakens discipline. Not every candle matters.
How New Traders Should Practice Using It
The safest way to learn is through chart review.
New traders should:
- Scroll back through charts
- Mark inverted hammers after downtrends
- Check what happened next
- Note which ones worked and which failed
Patterns become clearer when seen many times, not after reading one article.
Does the Inverted Hammer Work in All Markets
Yes, but behavior differs.
The inverted hammer Candlestick appears in:
- Forex markets
- Stock charts
- Crypto charts
- Index futures
The rules remain the same, but volatility changes outcomes. Faster markets may require wider stops and quicker decisions.
Does the Inverted Hammer Work in All Markets
Timeframes Matter
The pattern works on any timeframe, but reliability varies.
- Higher timeframes offer cleaner signals
- Lower timeframes show more noise
Daily and four-hour charts tend to provide better structure. Very small timeframes demand strict risk control.
When to Avoid Trading the Inverted Hammer
Sometimes the best trade is no trade.
Avoid setups when:
- Price is trapped in tight ranges
- News events are near
- Trend direction is unclear
Patience protects capital better than constant action.
Final Thoughts
The inverted hammer candlestick is not magic. It does not guarantee reversals or predict exact price moves. It simply shows that buyers stepped in after sustained selling.
Used alone, it fails often. Used with context, confirmation, and risk control, it becomes a helpful tool for spotting early changes in momentum.
Traders who treat it as a warning sign instead of a promise tend to last longer. Those who wait for proof instead of hope make better decisions over time. Especially when trading on forex trading platforms like entity Dominion Options, where tight spreads and fast execution help keep entries and exits clean. Traders who rush entries usually pay for it.
Understanding the inverted hammer candlestick pattern is not about memorizing rules. It is about reading what price is quietly saying before the crowd reacts.
FAQs: FAQs: Inverted Hammer Candlestick
1. How dependable is the inverted hammer candlestick pattern in real markets?
It performs best after a clear downtrend with strong follow-through. Without those conditions, most of the time it breaks down.
2. Does it guarantee a reversal?
No. It only suggests selling may be slowing. The market still needs to prove strength after the candle closes.
3. What happens if it forms in an uptrend?
In that case, it should be ignored. The same shape carries different meaning depending on the prior trend.
4. Does volume affect how this candlestick should be judged?
Yes. Higher volume supports the signal by showing real participation. Low volume reduces confidence.
5. Is a red inverted hammer candlestick considered a weak signal?
No. A red inverted hammer candlestick can still reflect positive buyer pressure. The long wick matters more than the close.
5. Should beginner traders use this candlestick pattern from the get go?
They can, but only with confirmation and controlled risk. Most losses happen when traders act too soon.