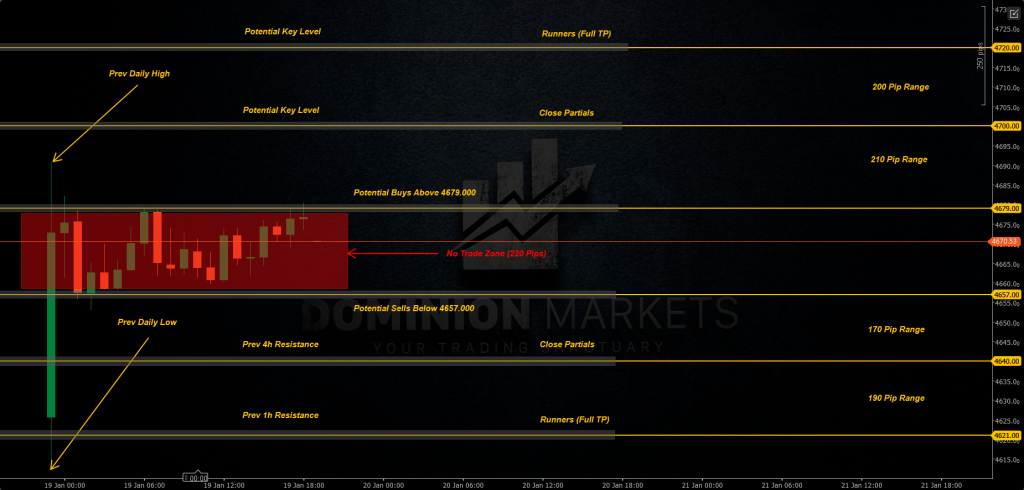
– I’ll be looking for potential Buys above 4679.000 targeting Potential Key Levels at 4700s and 4720s.
– I’ll be looking for potential Sells below 4657.000 targeting previous 4h Resistance formed at 4640.000 Leaving Runners to the previous 1h Resistance formed at 4621.000.
– The rally we’ve seen this Monday isn’t just a flash in the pan It’s a signal of a changing global landscape. With some analysts now eyeing the psychological $5,000 milestone before the year is out, the question for investors has shifted from ‘is it too high?’ to ‘how much higher can it go?