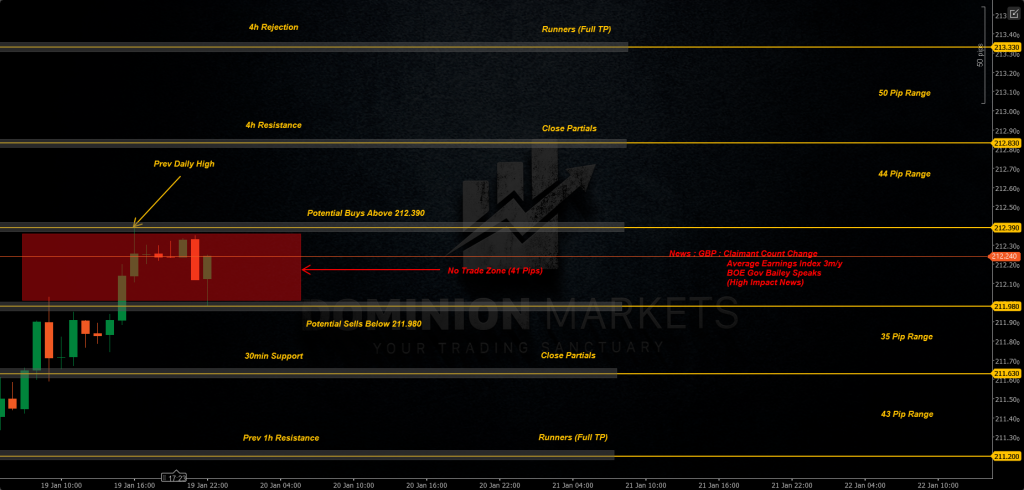
– I’ll be looking for potential Buys above 212.390 targeting 4h Resistance at 212.830 Leaving Runners to the 4h Rejection formed at 213.330.
– I’ll be looking for potential Sells below 211.980 targeting 30min Support at 211.630 Leaving Runners to the previous Hourly Resistance formed at 211.200.
– As we move into the Tuesday session, all eyes are on the high-impact GBP fundamental data for release. While the technical structure shows clear boundaries, the upcoming news cycle is expected to inject significant volatility into the market.