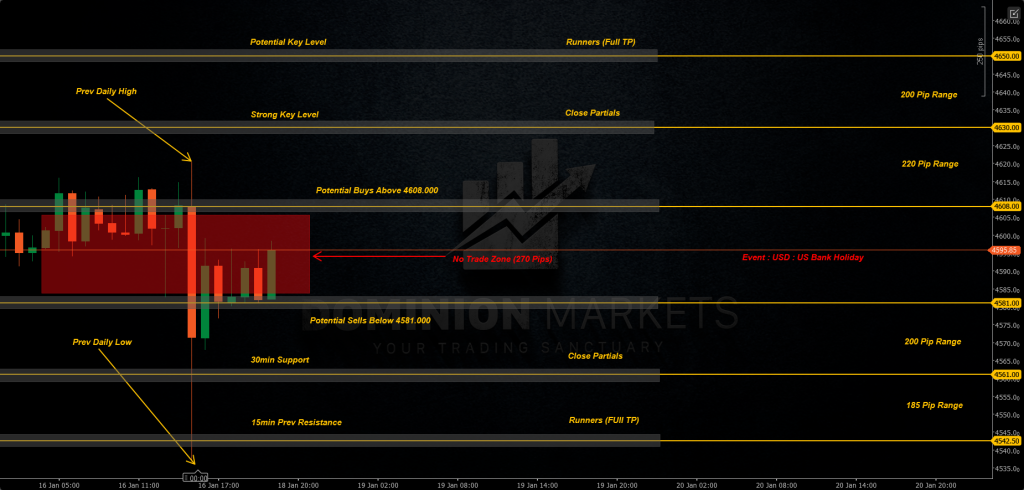
– I’ll be looking for potential Buys above 4608.000 targeting Strong Key Level at 4630.000 Leaving Runners to the Potential Key Level around 4650s.
– I’ll be looking for potential Sells below 4581.000 targeting 30min Support formed at 4561.000 Leaving Runners to the 15min previous Resistance formed at 4542.500.
– If gold can decisively break and hold above the $4,640–$4,650 resistance zone, it enters a new “price discovery” phase where $5,000 becomes the next psychological magnet.