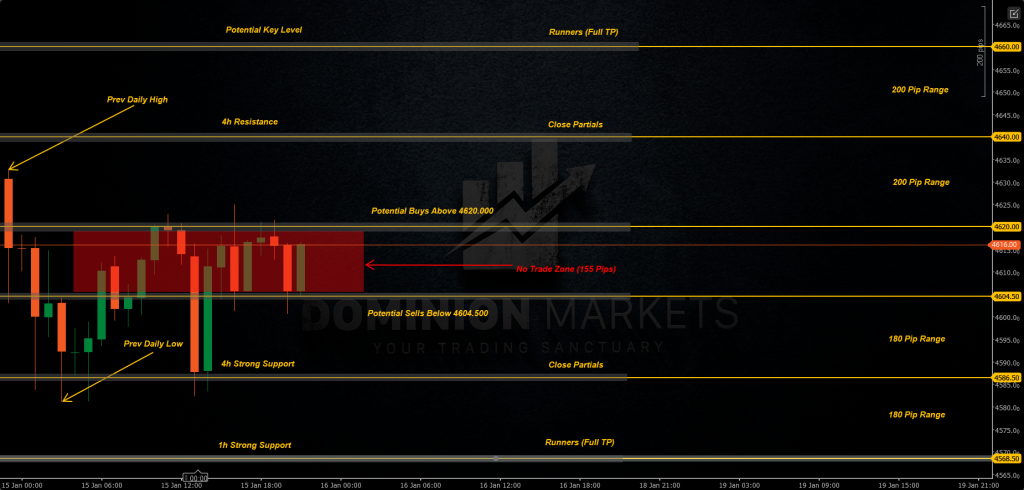
– I’ll be looking for potential Buys on clean break above 4620.000 targeting 4h Resistance at 4640.000 Leaving Runners to the next Potential Key Level around 4660.000.
– I’ll be looking for potential Sells below 4604.500 targeting 4h Strong Support at 4586.500 Leaving Runners to the Hourly Strong Support at 4568.500.
– As we head into the final trading session of the week, the ‘side-by-side’ formation on the daily chart has become the focal point for every major desk. By holding the $4,600 line throughout Thursday, gold has essentially hit the pause button at the top of a mountain. This lateral movement isn’t a sign of weakness; it’s a sign of a market waiting for a reason to commit to the next $100 move.