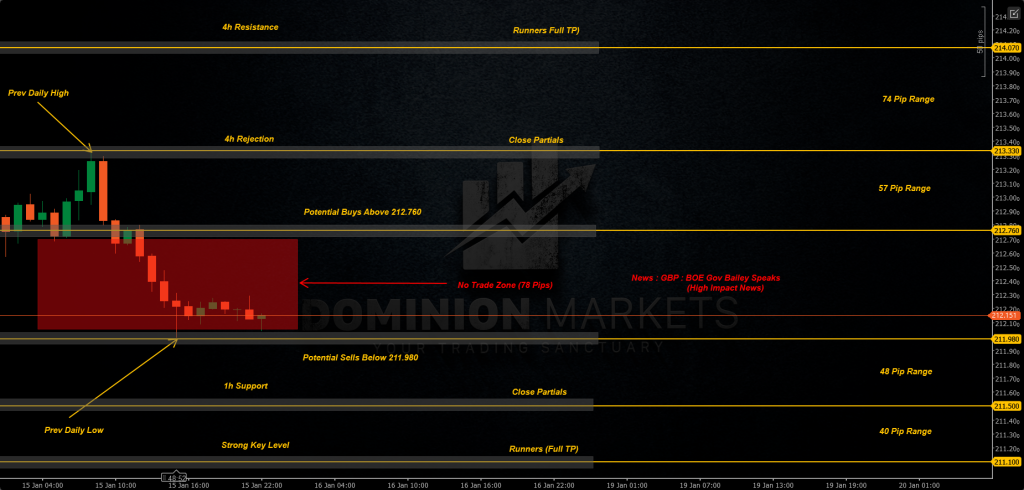
– I’ll be looking for potential Buys above 212.760 targeting 4h Rejection formed at 213.330 Leaving Runners to the 4h Resistance formed at 214.070.
– I’ll be looking for potential Sells below 211.980 targeting Hourly Support at 211.500 Leaving Runners to the Strong Key Level around 211.100.
– Zooming out to the weekly timeframe, the picture becomes even more significant. We are seeing the formation of a massive rejection wick to the upside so watch out for a potential reversal here.