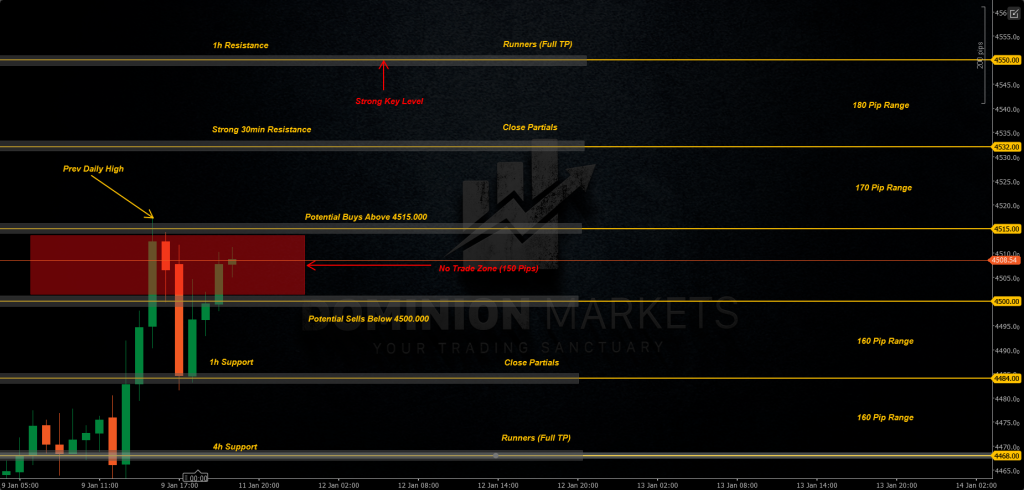
– I’ll be looking for potential Buys on clean break above 4515.000 targeting strong 30min Resistance formed at 4532.000 Leaving Runners to the Hourly Resistance which is also the Monthly Wick Fill at 4550.000.
– I’ll be looking for potential Sells below 4500.000 targeting recent Hourly Support formed at 4484.000 Leaving Runners to the 4h Support formed at 4468.000.
– While the charts are screaming bullish, the real test of this breakout will come from the heavy economic calendar. With US CPI data and Retail Sales on the horizon.