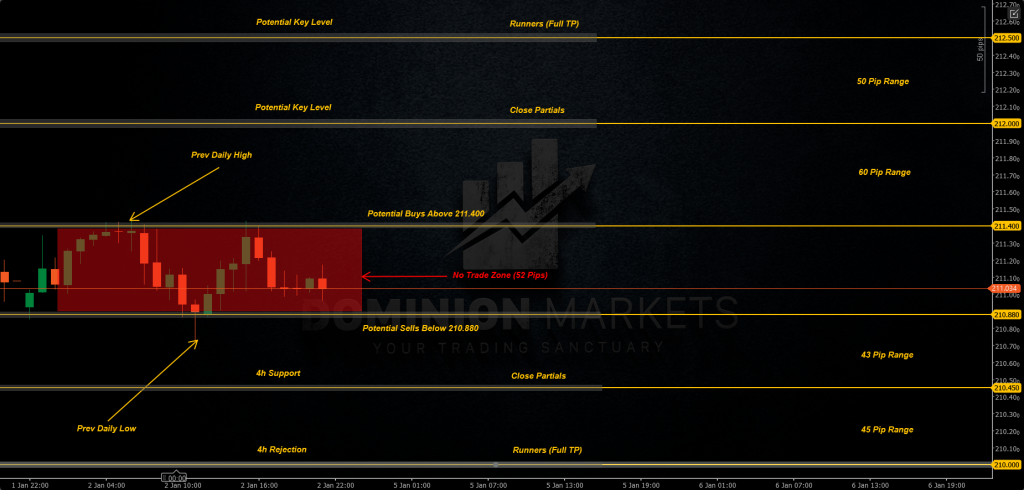
– I’ll be looking for potential Buys on a clean break above 211.400 targeting Potential Key Levels at 212.000 and 212.500.
– I’ll be looking for potential Sells below 210.880 targeting 4h recent Support at 210.450 Leaving Runners to the 4h Rejection formed the last week of December 2025 around 210.000.
– As the year comes to a start, price is currently deciding whether to gather momentum for a final continuation of the December trend or remain confined within this existing range. Patience is key for a breakout.