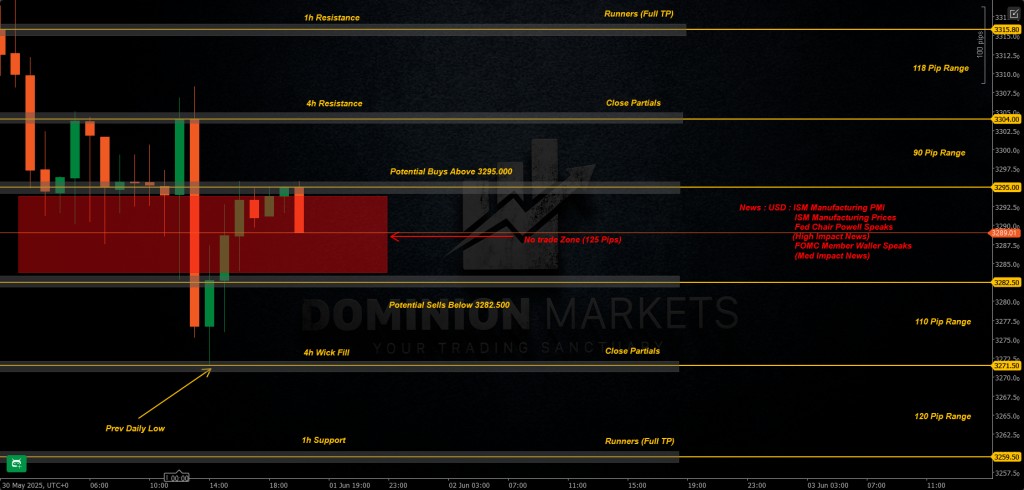
– I’ll be looking for potential Buys above 3295.000 targeting 4h Resistance formed at 3304.000 Leaving Runners to the Hourly Resistance formed at 3315.800.
– I’ll be looking for potential Sells below 3282.500 targeting 4h Wick Fill around 3271.500 Leaving Runners to the Hourly Support formed at 3259.500.
– As May comes to a close, the monthly candle prints a bearish doji — a clear sign of indecision following previous momentum. This sets the stage for a critical inflection point in the market. The big question heading into June is whether the current consolidation within the weekly range will finally resolve in continuation, or if we’re about to witness a major reversal. Key support and resistance levels have held firmly so far, but pressure is building.