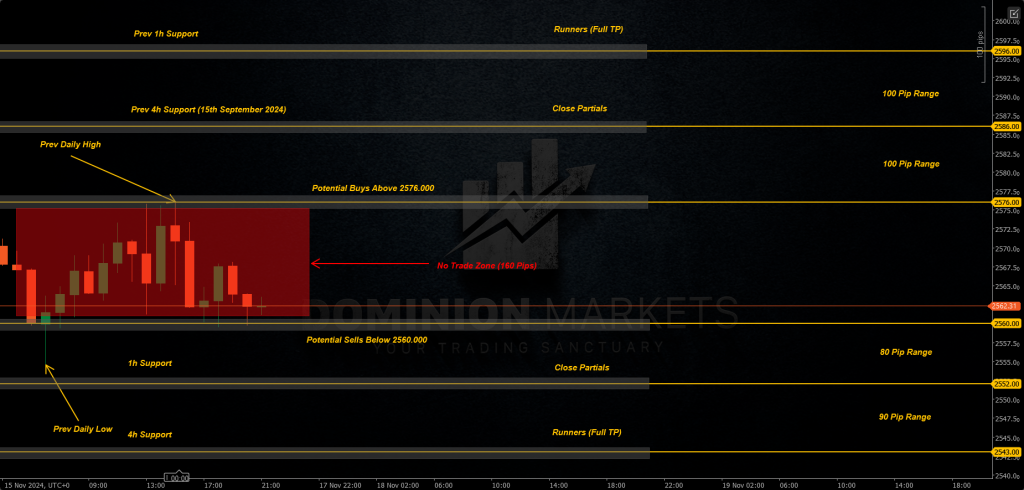
XAUUSD Technical Analysis 18th November 2024 1h chart
– Previous Weekly candle closed strong Bearish at 2562.300 Biggest Weekly drop since March 2020 , Friday Daily candle closed doji Bearish as price mostly ranged on the 4h timeframe. I’ll be looking for potential Buys above 2576.000 targeting previous 4h Support formed on 15th September 2024 around 2586.000 Leaving Runners to the previous Hourly Support formed at 2596.000. I’ll be looking for potential Sells below 2560.000 targeting Hourly Support at 2552.000 Leaving Runners to the 4h Support formed at 2543.000. Further Sells incoming on the higher timeframe but first price needs to form Support and retrace to correct part of the move before the continuation to the downside.