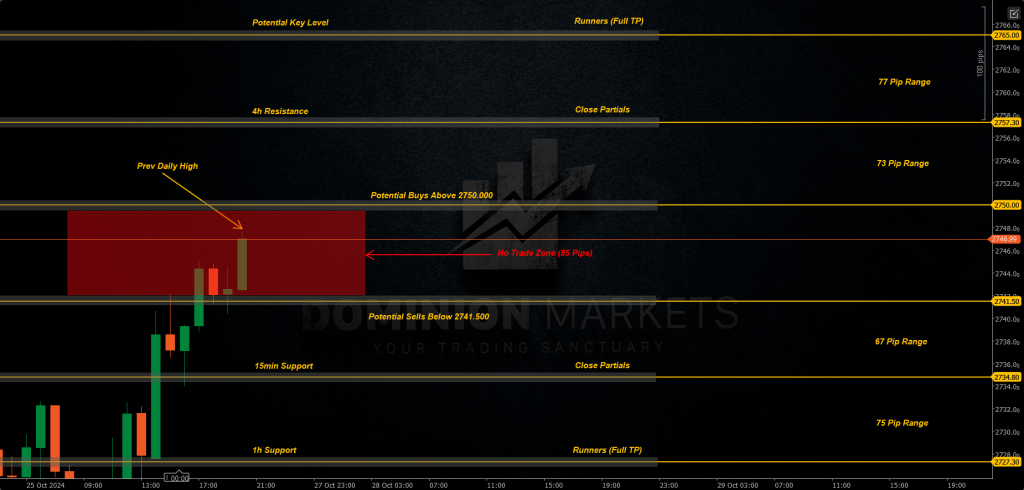
XAUUSD Technical Analysis 28th October 2024 1h chart
– Previous Weekly candle closed Bullish at 2747.000, Friday Daily candle closed Bullish within Daily Resistance formed on Tuesday 22nd October 2024. I’ll be looking for potential Buys above 2750.000 targeting 4h Resistance at 2757.300 Leaving Runners to 2765.000 targeting a potential Key Level. I’ll be looking for potential Sells below 2741.500 targeting 15min Support at 2734.800 Leaving Runners to the Hourly Support formed at 2727.300. Ideally is to allow the new Weekly candle to retrace and form bottom wick before the continuation to the upside.