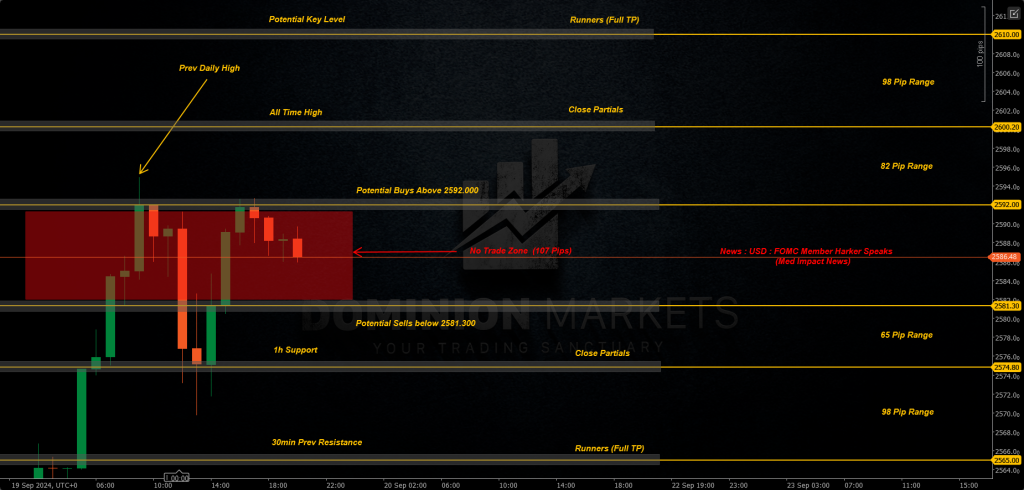
XAUUSD Technical Analysis 20th September 2024 1h chart
– Thursday Daily candle closed strong Bullish at 2586.300 closing above recent Daily Resistance forming strong Daily Support at 2558.200. I’ll be looking for potential Buys above 2592.000 targeting the All Time High formed on Wednesday around 2600.200 Leaving Runners to a next potential Key Level around 2610s. I’ll be looking for potential Sells below 2581.300 targeting Hourly Support formed at 2574.800 Leaving Runners to the 30min previous Resistance formed at 2565.000. Despite the Daily closing strong Bullish on Thursday giving a good confirmation for the continuation to the upside, there is still a probability for price to retrace and close below 2600s rejecting the Strong Key Level. Ideally is to have the Friday Daily candle closing Bearish allowing for price to retrace then for the next Weekly candle to form bottom wick before the continuation to the upside following the overall Bullish trend.